


このカタログについて
| ドキュメント名 | LTM4693 Ultrathin Low VIN, 2A Buck-Boost µModule Regulator |
|---|---|
| ドキュメント種別 | 製品カタログ |
| ファイルサイズ | 1.2Mb |
| 取り扱い企業 | マウザー・エレクトロニクス (この企業の取り扱いカタログ一覧) |
この企業の関連カタログ


このカタログの内容
Page1
Features、Applications、Typical Application 、Description
LTM4693
Ultrathin Low VIN, 2A Buck-Boost
µModule Regulator
FEATURES DESCRIPTION
n Wide Input Voltage Range: 2.6V to 5.5V The LTM®4693 is an ultrathin, highly efficient, 2A buck-
n Adjustable Output Voltage Range: 1.8V to 5.5V boost µModule® DC/DC converter that operates from
n 2A of Continuous Output Current with VIN ≥ VOUT input voltages above, below or equal to the output volt-
(Buck Mode and Buck-Boost Mode); age. Included in the package are the switching control-
Minimum 1A Continuous Output Current ler, power MOSFETs, inductor and support components.
with VIN < VOUT (Boost Mode). The LTM4693’s advanced topology provides a continu-
n Low Ripple Buck-Boost Architecture ous transfer through all operating modes. VIN operation
n Programmable Soft-Start and VIN UVLO from 2.6V to 5.5V covers a wide variety of power sources
n Burst Mode IQ 15μA for High Efficiency at Light Loads including typical 3.3V and 5V. Output voltage ranging
n Ultrathin, Small Surface Mount Footprint from 1.8V to 5.5V is set by an external resistor. Only a few
3.5mm × 4mm × 1.25mm LGA Package external components are needed for a typical application.
Selectable Burst Mode® operation reduces quiescent cur-
APPLICATIONS rent to 15μA, ensuring high efficiency across the entire
Telecom, Datacom (Optical Modules) and load range. To optimize applications for highest efficiency,
n
Industrial Equipment the switching frequency can be programmed between
Medical and Industrial Instruments 1MHz to 4MHz or synchronized to an external clock for
n
Wireless RF Transmitter noise sensitive circuits.
n
n Battery Powered System LTM4693 is available in ultrathin, 3.5mm × 4mm ×1.25mm
LGA Package. The LTM4693 is Pb-free and RoHS compliant.
All registered trademarks and trademarks are the property of their respective owners.
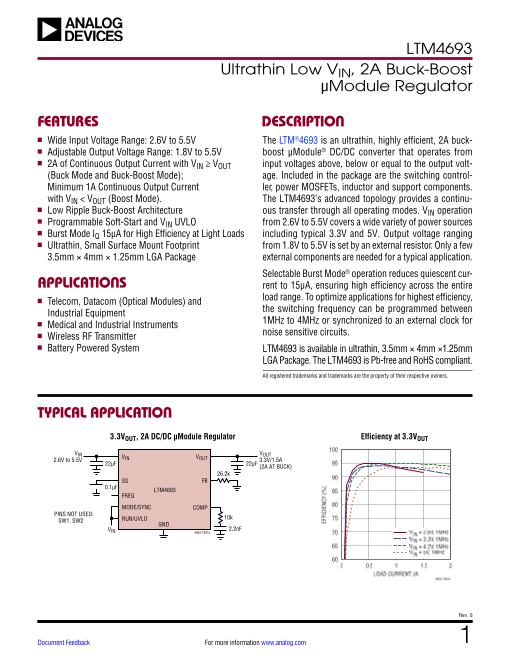
TYPICAL APPLICATION
3.3VOUT, 2A DC/DC µModule Regulator Efficiency at 3.3VOUT
100
VIN VOUT
2.6V to 5.5V VIN VOUT 3.3V/1.5A
22µF 22µF (2A AT BUCK) 95
26.2k 90
SS FB
0.1µF LTM4693 85
FREQ
MODE/SYNC COMP 80
PINS NOT USED:
SW1, SW2 RUN/UVLO 10k 75
GND
VIN 2.2nF
4693 TA01a 70 VIN = 2.6V, 1MHz
VIN = 3.3V, 1MHz
65 VIN = 4.2V, 1MHz
VIN = 5V, 1MHz
60
0 0.5 1 1.5 2
LOAD CURRENT (A)
4693 TA01a
Rev. 0
Document Feedback For more information www.analog.com 1
EFFICIENCY (%)
Page2
Absolute Maximum Ratings、Order Information、Pin Configuration
LTM4693
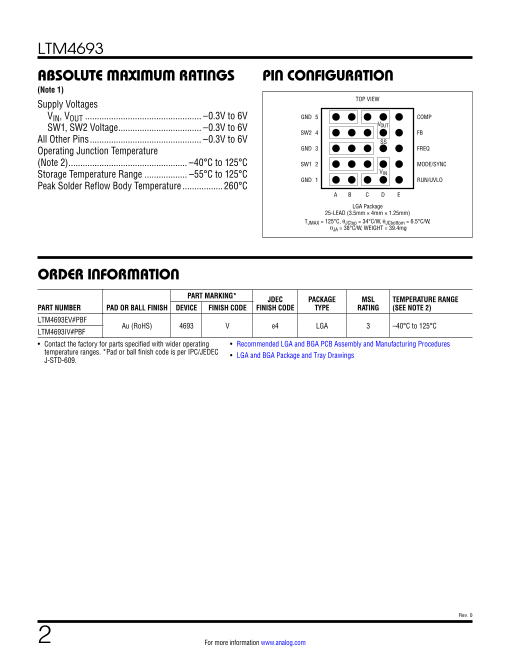
ABSOLUTE MAXIMUM RATINGS PIN CONFIGURATION
(Note 1)
TOP VIEW
Supply Voltages
VIN, VOUT ................................................. –0.3V to 6V GND 5 COMP
SW1, SW2 Voltage ................................... –0.3V to 6V VOUT
SW2 4 FB
All Other Pins ............................................... –0.3V to 6V SS
Operating Junction Temperature GND 3 FREQ
(Note 2) .................................................. –40°C to 125°C SW1 2 MODE/SYNC
Storage Temperature Range .................. –55°C to 125°C VIN
GND 1 RUN/UVLO
Peak Solder Reflow Body Temperature ................. 260°C
A B C D E
LGA Package
25-LEAD (3.5mm × 4mm × 1.25mm)
TJMAX = 125°C, θJCtop = 34°C/W, θJCbottom = 6.5°C/W,
θJA = 38°C/W, WEIGHT = 39.4mg
ORDER INFORMATION
PART MARKING* JDEC PACKAGE MSL TEMPERATURE RANGE
PART NUMBER PAD OR BALL FINISH DEVICE FINISH CODE FINISH CODE TYPE RATING (SEE NOTE 2)
LTM4693EV#PBF
Au (RoHS) 4693 V e4 LGA 3 –40°C to 125°C
LTM4693IV#PBF
• Contact the factory for parts specified with wider operating • Recommended LGA and BGA PCB Assembly and Manufacturing Procedures
temperature ranges. *Pad or ball finish code is per IPC/JEDEC • LGA and BGA Package and Tray Drawings
J-STD-609.
Rev. 0
2 For more information www.analog.com
Page3
Electrical Characteristics
LTM4693
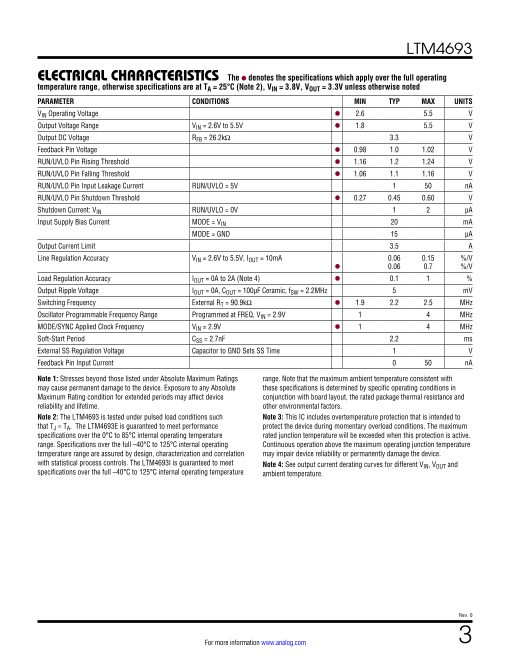
E LECTRICAL CHARACTERISTICS The l denotes the specifications which apply over the full operating
temperature range, otherwise specifications are at TA = 25°C (Note 2), VIN = 3.8V, VOUT = 3.3V unless otherwise noted
PARAMETER CONDITIONS MIN TYP MAX UNITS
VIN Operating Voltage l 2.6 5.5 V
Output Voltage Range VIN = 2.6V to 5.5V l 1.8 5.5 V
Output DC Voltage RFB = 26.2kΩ 3.3 V
Feedback Pin Voltage l 0.98 1.0 1.02 V
RUN/UVLO Pin Rising Threshold l 1.16 1.2 1.24 V
RUN/UVLO Pin Falling Threshold l 1.06 1.1 1.16 V
RUN/UVLO Pin Input Leakage Current RUN/UVLO = 5V 1 50 nA
RUN/UVLO Pin Shutdown Threshold l 0.27 0.45 0.60 V
Shutdown Current: VIN RUN/UVLO = 0V 1 2 µA
Input Supply Bias Current MODE = VIN 20 mA
MODE = GND 15 µA
Output Current Limit 3.5 A
Line Regulation Accuracy VIN = 2.6V to 5.5V, IOUT = 10mA 0.06 0.15 %/V
l 0.06 0.7 %/V
Load Regulation Accuracy IOUT = 0A to 2A (Note 4) l 0.1 1 %
Output Ripple Voltage IOUT = 0A, COUT = 100µF Ceramic, fSW = 2.2MHz 5 mV
Switching Frequency External RT = 90.9kΩ l 1.9 2.2 2.5 MHz
Oscillator Programmable Frequency Range Programmed at FREQ, VIN = 2.9V 1 4 MHz
MODE/SYNC Applied Clock Frequency VIN = 2.9V l 1 4 MHz
Soft-Start Period CSS = 2.7nF 2.2 ms
External SS Regulation Voltage Capacitor to GND Sets SS Time 1 V
Feedback Pin Input Current 0 50 nA
Note 1: Stresses beyond those listed under Absolute Maximum Ratings range. Note that the maximum ambient temperature consistent with
may cause permanent damage to the device. Exposure to any Absolute these specifications is determined by specific operating conditions in
Maximum Rating condition for extended periods may affect device conjunction with board layout, the rated package thermal resistance and
reliability and lifetime. other environmental factors.
Note 2: The LTM4693 is tested under pulsed load conditions such Note 3: This IC includes overtemperature protection that is intended to
that TJ ≈ TA. The LTM4693E is guaranteed to meet performance protect the device during momentary overload conditions. The maximum
specifications over the 0°C to 85°C internal operating temperature rated junction temperature will be exceeded when this protection is active.
range. Specifications over the full –40°C to 125°C internal operating Continuous operation above the maximum operating junction temperature
temperature range are assured by design, characterization and correlation may impair device reliability or permanently damage the device.
with statistical process controls. The LTM4693I is guaranteed to meet Note 4: See output current derating curves for different VIN, VOUT and
specifications over the full –40°C to 125°C internal operating temperature ambient temperature.
Rev. 0
For more information www.analog.com 3
Page4
Typical Performance Characteristics
LTM4693
TYPICAL PERFORMANCE CHARACTERISTICS
1.8VOUT Efficiency,
1.8VOUT Efficiency, 1MHz, CCM 1MHz, Burst Mode Operation 2.5VOUT Efficiency, 1MHz,CCM
100 100 100
95 90 95
80
90 90
70
85 60 85
80 50 80
75 40 75
30
70 70
VIN = 2.6V 20 VIN = 2.6V VIN = 2.6V
65 VIN = 3.3V 10 VIN = 3.3V 65 VIN = 3.3V
VIN = 5V VIN = 5V VIN = 5V
60 0 60
0 0.5 1 1.5 2 0.0001 0.001 0.01 0.1 1 2 0 0.5 1 1.5 2
LOAD CURRENT (A) LOAD CURRENT (A) LOAD CURRENT (A)
4693 G01 4693 G02 4693 G03
2.5VOUT Efficiency, 1MHz, Burst 3.3VOUT Efficiency,
Mode Operation 3.3VOUT Efficiency, 1MHz, CCM 1MHz, Burst Mode Operation
100 100 100
90 95 90
80 80
90
70 70
60 85 60
50 80 50
40 75 40
30 30
70 V = 2.6V V = 2.6V
20 IN IN
VIN = 2.6V VIN = 3.3V 20 VIN = 3.3V
10 VIN = 3.3V 65 VIN = 4.2V 10 VIN = 4.2V
VIN = 5V VIN = 5V VIN = 5V
0 60 0
0.0001 0.001 0.01 0.1 1 2 0 0.5 1 1.5 2 0.0001 0.001 0.01 0.1 1 2
LOAD CURRENT (A) LOAD CURRENT (A) LOAD CURRENT (A)
4693 G04 4693 G05 4693 G06
5VOUT Efficiency,
5VOUT Efficiency, 1MHz, CCM 1MHz, Burst Mode Operation Output Ripple
100 100
95 90
80
90 VOUT
70 AC-COUPLED
85 20mV/DIV
60
80 50
75 40
30
70 500ns/DIV 4693 G09
VIN = 2.6V 20 VIN = 2.6V VIN = 3.3V, VOUT = 3.3V, fSW = 2.2MHz
65 VIN = 3.3V 10 VIN = 3.3V ILOAD = 0.8A, COUT = 22μF CERAMIC CAP
VIN = 5V VIN = 5V
60 0
0 0.5 1 1.5 2 0.0001 0.001 0.01 0.1 1 2
LOAD CURRENT (A) LOAD CURRENT (A)
4693 G07 4693 G08
Rev. 0
4 For more information www.analog.com
EFFICIENCY (%) EFFICIENCY (%) EFFICIENCY (%)
EFFICIENCY (%) EFFICIENCY (%) EFFICIENCY (%)
EFFICIENCY (%) EFFICIENCY (%)
Page5
LTM4693
TYPICAL PERFORMANCE CHARACTERISTICS
Load Transient Response Load Transient Response Load Transient Response
2.6VIN to 5VOUT 3.3VIN to 1.8VOUT 3.3VIN to 3.3VOUT
VOUT VOUT VOUT
200mV/DIV 100mV/DIV 100mV/DIV
IOUT IOUT IOUT
0.5A/DIV 0.5A/DIV 0.5A/DIV
100µs/DIV 4693 G10 100µs/DIV 4693 G11 100µs/DIV 4693 G12
VIN = 2.6V, VOUT = 5V, fSW = 1MHz VIN = 3.3V, VOUT = 1.8V, fSW = 1MHz VIN = 3.3V, VOUT = 3.3V, fSW = 1MHz
COUT = 2× 22μF CERAMIC CAP COUT = 2× 22μF CERAMIC CAP COUT = 2× 22μF CERAMIC CAP
CTH = 2200pF, RTH = 10k CTH = 2200pF, RTH = 10k CTH = 2200pF, RTH = 10k
LOAD STEP 1A–1.5A LOAD STEP 1A–2A LOAD STEP 1A–2A
Load Transient Response Load Transient Response
5VIN to 3.3VOUT 5VIN to 5VOUT Start-Up with No Load
VOUT
VOUT VOUT 2V/DIV
100mV/DIV 200mV/DIV
IOUT IOUT
0.5A/DIV 0.5A/DIV IOUT
1A/DIV
100µs/DIV 4693 G13 100µs/DIV 4693 G14 500µs/DIV 4693 G15
VIN = 5V, VOUT = 3.3V, fSW = 1MHz VIN = 5V, VOUT = 5V, fSW = 1MHz VIN = 3.3V, VOUT = 3.3V, fSW = 1MHz, 0A LOAD
COUT = 2× 22μF CERAMIC CAP COUT = 2× 22μF CERAMIC CAP COUT = 3× 22μF + 3× 2.2μF CERAMIC
CTH = 2200pF, RTH = 10k CTH = 2200pF, RTH = 10k SOFT-START CAPACITOR = 0.01μF
LOAD STEP 1A–2A LOAD STEP 1A–2A USE RUN PIN TO CONTROL START-UP
Start-Up with 2A Load Short-Circuit with No Load Short-Circuit with 2A Load
VOUT V
2V/DIV VOUT OUT
2V/DIV 2V/DIV
IOUT
1A/DIV IIN
5A/DIV IIN
2A/DIV
1ms/DIV 4693 G16
100µs/DIV 4693 G17 100µs/DIV 4693 G18
VIN = 3.3V, VOUT = 3.3V, fSW = 1MHz, 2A LOAD
C = 3× 22μF + 3× 2.2μF CERAMIC VIN = 3.3V, VOUT = 3.3V, fSW = 1MHz, 0A LOAD VIN = 3.3V, VOUT = 3.3V, fSW = 1MHz, 2A LOAD
OUT
SOFT-START CAPACITOR = 0.01μF COUT = 3× 22μF + 3× 2.2μF CERAMIC COUT = 3× 22μF + 3× 2.2μF CERAMIC
USE RUN PIN TO CONTROL START-UP
Rev. 0
For more information www.analog.com 5
Page6
Pin Functions
LTM4693
PIN FUNCTIONS
PACKAGE ROW AND COLUMN LABELING MAY VARY MODE/SYNC (Pin E2): Mode Selection and Oscillator
AMONG µModule PRODUCTS. REVIEW EACH PACKAGE Synchronization. Do not leave this pin floating.
LAYOUT CAREFULLY.
MODE/SYNC = High (VIN). Disable Burst Mode opera-
GND (Pins A1, B1, A3, B3, C3, A5, B5): Power Ground tion and maintain low noise, constant frequency
Connection. These pins and exposed thermal pad must PWM operation.
make full connection to PCB ground plane to meet specific
thermal requirements. MODE/SYNC = Low (GND). The converter operates in
Burst Mode operation.
SW1 (Pins A2, B2, C2): Buck-Boost Converter Switching
Node Pin 1. MODE/SYNC = External CLK. The internal oscillator is syn-
chronized to the external CLK signal, Burst Mode opera-
SW2 (Pins A4, B4, C4): Buck-Boost Converter Switching tion is disabled. A clock pulse width between 75ns and
Node Pin 2. tperiod –75ns is required to synchronize the oscillator. An
VIN (Pins C1, D1, D2): Power Input for Buck-Boost external resistor must be connected between FREQ and
Converter. Connect a minimum 22μF low ESR capacitor GND to program the oscillator 25% to 50% below the
to GND as close to the device as possible. desired synchronization frequency.
VOUT (Pins C5, D4, D5): Power Output for Buck-Boost FREQ (Pin E3): Oscillator Frequency Programming Input.
Converter. Connect a minimum 22μF low ESR capacitor Default switching frequency is 1MHz when this pin is left
to GND as close to the device as possible. Capacitor value floating. Connect an external RT resistor from FREQ to
may change depending on VOUT voltage and load current GND to program the switching frequency from 1MHz to
requirements. 4MHz according to Equation 2.
SS (Pin D3): External Soft-Start. Connect to VIN for 2ms 110
R (kΩ) = (2)
default soft-start period. Connect an external capacitor to T
fSW (MHz) – 1
set soft-start period according to Equation 1.
FB (Pin E4): Feedback Input to Error Amplifier. The resis-
tSS (ms) = 0.8 • CSS (nF) (1) tor connected to this pin sets the converter output voltage
RUN/UVLO (Pin E1): Input to Enable the IC. Connect (Equation 3).
RUN to VIN to enable the LTM4693 at the 2.6V minimum R + 60.4k
V = 1.0V • FB (3)
operating voltage. Connect to an external divider from V OUT
IN RFB
to provide a programmable accurate VIN undervoltage
threshold, see application information for details. COMP (Pin E5): The output of the voltage error ampli-
fier used to program average inductor current inside the
module. An R-C from this pin to ground sets the voltage
loop compensation.
Rev. 0
6 For more information www.analog.com
Page7
Block Diagram
LTM4693
BLOCK DIAGRAM
SW1 L SW2
0.47µH
V V V
IN IN Q1 Q2 Q3 Q4 OUT VOUT
2.6V TO 5.5V 3.3V/2A
22μF 22μF
60.4k
RUN/UVLO FB
26.2k
MODE/SYNC SS
4 SWITCH BUCK-BOOST CONTROLLER
0.1μF
FREQ COMP
110k 22pF 10k
2.2nF
GND
4693 BD
Rev. 0
For more information www.analog.com 7
Page8
Operation
LTM4693
OPERATION
The LTM4693 is a standalone nonisolated buck-boost switching frequency is set by connecting the appropriate
switching DC/DC power supply. The buck-boost topology resistor value from the FREQ pin to GND. The LTM4693
allows the LTM4693 to regulate its output voltage above default frequency is 1MHz, and it can be configured to
or below the input voltage, and the maximum output cur- operate over a wide range of switching frequencies, from
rent depends upon the input voltage. In buck and buck- 1MHz to 4MHz, allowing applications to be optimized for
boost region, the converter can source 2A output current, broad area and efficiency. Driving the MODE/SYNC pin will
while in boost region, the converter can source at least synchronize the LTM4693 to an external clock.
1A output current. The low RDS(ON), low gate charge syn- Burst Mode operation is available in the LTM4693 and is
chronous switches and low DCR inductor inside provide user-selected via the MODE/SYNC input pin. In Burst Mode
highly efficient power module with a tiny 3.5mm × 4mm operation, the LTM4693 provides exceptional efficiency at
× 1.25mm size. The LTM4693 utilizes a proprietary low light output loads by operating the converter only when
noise switching algorithm to provide a seamless transi- necessary to maintain voltage regulation. The typical
tion between operating modes. These advantages result quiescent current in Burst Mode operation is only 15μA
in increased efficiency and stability in comparison to the at no load. At higher loads, the LTM4693 automatically
traditional buck-boost converter. A simplified block dia- transitions to fixed frequency PWM operation. Continuous
gram is given on the previous page. PWM mode can also be selected via the MODE/SYNC pin
The LTM4693 provides a precisely regulated output volt- for low switching ripple and low noise operation.
age programmable from 1.8V to 5.5V via an external The LTM4693 features an accurate, resistor programma-
resistor connecting from the FB pin to GND. The input ble RUN/UVLO comparator which allows the buck-boost
voltage range is from 2.6V to 5.5V. DC/DC converter to turn on and off at user-selected volt-
The LTM4693 utilizes average current mode control age thresholds depending on the power source. Besides,
for its pulse width modulator. Current mode control, the soft-start period is also programmable by an appropri-
both average and the better known peak method, pro- ate capacitor connecting from SS to GND.
vide some benefits compared to other control methods
including: simplified loop compensation, rapid response
to load transients and inherent line voltage rejection. The
Rev. 0
8 For more information www.analog.com
Page9
Applications Information
LTM4693
APPLICATIONS INFORMATION
The front page shows a typical LTM4693 application SETTING THE SWITCHING FREQUENCY
circuit. This Applications Information section serves as The operating frequency of the LTM4693 is optimized
a guideline of selecting external components for typi- to achieve the compact package size and the minimum
cal applications. The examples and equations in this output ripple voltage while keeping high efficiency. The
section assume continuous conduction mode unless default operating frequency is internally set to 1MHz by
otherwise specified. an internal resistor. In most applications, no additional
frequency adjusting is required.
VIN UVLO THRESHOLD
If any operating frequency higher than 1MHz is required
The VIN threshold is internally set to a typical value of by application, the operating frequency can be adjusted
1.7V for turn-on and 1.6V for turn-off when RUN/UVLO by adding a resistor RT between FREQ pin and GND. The
is connected to VIN. The VIN UVLO can be adjusted to a RT resistor required to set a specific switching frequency
higher threshold voltage with a resistor network on RUN/ can be calculated with Equation 7.
UVLO according to Equation 4 and Equation 5. 110
V R (kΩ)= (7)
TURN(ON) =1.2V •(1+R1/R2) (4) T
fSW(MHz)−1
The accurate RUN/UVLO pin threshold has 100mV of hys- The programmable operating frequency range is from
teresis provided internally. 1MHz to 4MHz. The typical value of RT and the switching
V (5)
TURN(OFF) =1.1V •(1+R1/R2) frequency is shown as Table 1.
Table 1. RT Value for Common Switching Frequencies
LTM4693 fSW RT
VIN 1.0MHz OPEN
R1
2.0MHz 110kΩ
RUN/UVLO
3.0MHz 55kΩ
R2
4693 F01 4.0MHz 36.5kΩ
Figure 1. Circuit to Set VIN UVLO The LTM4693 can be synchronized to an external clock
OUTPUT VOLTAGE PROGRAMMING applied to the MODE/SYNC pin. The frequency of the
external clock must be higher than the internal oscillator
The PWM controller has an internal 1V reference voltage. frequency as set by the FREQ pin. In order to accom-
As shown in the Block Diagram, a 60.4k internal feedback modate the ±20% possible variation in the oscillator fre-
resistor connects from VFB to VOUT. Adding a resistor quency, the R
R from FB pin to GND pin programs the output voltage T resistor should be chosen to set the inter-
FB nal oscillator frequency between 25% to 50% below the
(Equation 6). synchronization frequency. For example, to synchronize
= 60.4k+RFB to an external 2.5MHz clock, RT should be selected to set
VOUT 1.0V • (6)
RFB the internal oscillator at 1.9MHz or lower.
Rev. 0
For more information www.analog.com 9
Page10
LTM4693
APPLICATIONS INFORMATION
SOFT-START of the output capacitor need to be considered. In most
The soft-start circuit linearly ramps the average induc- LTM4693 applications, an output capacitor between 68µF
tor current during the soft-start period (t ). An internal and 220µF from VOUT to GND will work well. An additional
SS
soft-start interval of approximately 2ms can be selected low value ceramic capacitor such as 4.7µF can be placed
by connecting SS to V . For applications requiring a lon- between VOUT to GND to reduce switching noise to the
IN
ger soft-start period, an external capacitor C on SS sets control circuitry. The LTpowerCAD® design tool is avail-
SS
soft-start period according to Equation 8. The total soft- able to download online to perform ripple analysis based
start time can be calculated as: on certain number and type of the capacitors.
tSS (ms) = 0.8 • CSS (nF) (8) INPUT DECOUPLING CAPACITORS
V DEFAULT 2ms
IN The VIN pin carries the full inductor current, provides
SS SOFT-START
power to internal switches and drivers, and powers con-
CSS VIN trol circuits in the IC. To minimize input voltage ripple
PROGRAMMABLE SS and ensure proper operation of the IC, a low ESR bypass
SOFT-START capacitor with a value of at least 22µF should be located as
4693 F02 close to VIN as possible. The traces connecting this capac-
Figure 2. Circuit to Set Soft-Start Time itor to VIN and the ground plane (GND) should be made as
where C is the capacitance on the SS pin. short as possible. An additional low value ceramic capaci-
SS tor such as 4.7µF can be placed between VIN and GND to
The soft-start circuit slowly ramps the error amplifier reduce switching noise to the control circuitry.
output at VC. In doing so, the current command of the
IC is slowly increased, starting from zero. The soft-start RECOMMENDED INPUT AND OUTPUT CAPACITORS
period is defined as the time it takes the SS capacitor to
ramp to 0.9V, allowing VC to command full rated current. The capacitors used to filter the input and output of the
In most situations, VOUT comes into regulation without LTM4693 must have low ESR and must be rated to handle
needing full inductor current, resulting in power up times the large AC currents generated by the switching con-
at a fraction of the soft-start period. After initial power up, verters. While there are many capacitor types for these
soft-start can be reset by VIN UVLO asserting, thermal applications (including low ESR tantalum, OSCON and
shutdown, or a VOUT short-circuit. POSCAP), ceramic capacitors are often utilized in switch-
ing converter applications due to their small size, low ESR
OUTPUT CAPACITORS and low leakage currents. The major providers of ceramic
capacitors are AVX, Kemet, Murata, Taiyo Yuden and TDK.
A low effective series resistance (ESR) output capacitor Many ceramic capacitors intended for power applica-
should be connected at the output of the buck-boost con- tions experience a significant loss in capacitance from
verter in order to minimize output voltage ripple. Multilayer their rated value as the DC bias voltage on the capacitor
ceramic capacitor is an excellent option as it has low ESR increases. It is not uncommon for a small surface mount
and is available in small footprint. The capacitor value capacitor to lose more than 50% of its rated capacitance
should be chosen large enough to reduce the output when operated near its maximum rated voltage. This
voltage ripple to acceptable levels. The output voltage effect is generally reduced as the case size is increased
ripple increases with load current and is generally higher for the same nominal value capacitor. As a result, it is
in boost mode than in buck mode. Both output voltage often necessary to use a larger value capacitance or a
ripple generated across the output capacitance, and out- higher voltage rated capacitor than would ordinarily be
put voltage ripple produced across the internal resistance required to actually realize the intended capacitance at
Rev. 0
10 For more information www.analog.com
Page11
LTM4693
APPLICATIONS INFORMATION
the operating voltage of the application. X5R, X6S or X7R conversion efficiency when the output load is light. Since
dielectric types are recommended as they exhibit the best the converter is not operating in sleep, the output voltage
performance over the wide operating and temperature will slowly decay at a rate determined by the output load
ranges. To verify that the intended capacitance is achieved resistance and the output capacitor value. When the out-
in the application circuit, be sure to consult the capacitor put voltage has decayed by a small amount, typically less
vendor’s curve of capacitance vs DC bias voltage. than 1%, the LTM4693 will wake up and resume normal
switching operation until the voltage on VOUT is restored
FORCED CONTINUOUS MODE (FCM) to the previous level. If the load is very light, the LTM4693
may only need to switch for a few cycles to restore VOUT
If the MODE/SYNC pin is high or if the load current on the and may sleep for extended periods of time, significantly
converter is high enough to enter forced continuous mode improving efficiency.
operation, the LTM4693 operates at a fixed frequency pro-
grammed by the FREQ pin. FCM minimizes output voltage
ripple and yields a low noise switching frequency spec- AVERAGE CURRENT MODE CONTROL AND STABILITY
trum. A proprietary switching algorithm provides seam- COMPENSATION
less transitions between operating modes and eliminates The LTM4693 utilizes average current mode control for
discontinuities in the average inductor current, inductor the pulse width modulator as shown in Figure 3. Current
ripple current and loop transfer function throughout all mode control, both average and the better known peak
modes of operation. These advantages result in increased methods, enjoy some benefits compared to other con-
efficiency, improved loop stability, and lower output volt- trol methods including: simplified loop compensation,
age ripple. In response to the internal control loop com- rapid response to load transients and inherent line
mand, an internal pulse width modulator generates the voltage rejection.
appropriate switch duty cycle to maintain regulation of Referring to Figure 3, an internal high gain transconduc-
the output voltage. tance error amplifier labeled VAMP monitors VOUT through
a voltage divider connected to the FB node and generates
Burst Mode OPERATION an output, VC, used by the current mode control loop
When the MODE/SYNC pin is held low, the LTM4693 is to command the appropriate inductor current level. To
configured for Burst Mode operation. As a result, the ensure stability, external frequency compensation com-
buck-boost DC/DC converter will operate with normal ponents (RC and CC) must be installed between VC and
continuous PWM switching above a predetermined aver- GND and CHF is optional.
age inductor current and will automatically transition to VC is internally connected to the non-inverting input of
power saving Burst Mode operation below this level. With a second amplifier, referred to in Figure 3 as IAMP. The
MODE/SYNC low, at light output loads, the LTM4693 will inverting input of the average current amplifier is con-
go into a standby or sleep state when the output voltage nected to the inductor current sense resistor RCS with a
achieves its nominal regulation level. The sleep state halts 200mV offset. IAMP contains an internal averaging filter
PWM switching and powers down all non-essential func- and frequency compensation network to stabilize opera-
tions of the IC, significantly reducing the quiescent cur- tion of the internal current loop. The average current
rent of the LTM4693. This greatly improves overall power amplifier’s output (ICOMP) provides the cycle-by-cycle
Rev. 0
For more information www.analog.com 11
Page12
LTM4693
APPLICATIONS INFORMATION
INDUCTOR
I
CURRENT SENSE L
SW1 SW2
IAMP
R PWM
VOUT CS –
INTERNAL ICOMP
+ CURRENT
AMPLIFIER TO
R3 PWM RAMPS/ SWITCHES
OSCILLATOR
FB VAMP
– DRIVE
V LOGIC
C
+ 4693 F03
1V
R4
CLAMP
0.9V
RC CHF
CC
Figure 3. Average Current Mode Control Loop
duty cycle command into the buck-boost PWM circuitry. voltage controlled current source, with the driving volt-
The inductor current sensing circuitry alternately mea- age coming from VC. The voltage error amplifier moni-
sures the current through the power switches. The output tors VOUT through a voltage divider and makes adjust-
of the sensing circuitry produces a voltage across resis- ments to the current command as necessary to maintain
tor RCS that resembles the inductor current waveform regulation. The voltage error amplifier therefore controls
transformed to a voltage. If there is an increase in the the outer voltage regulation loop. The average current
power converter load on VOUT, the instantaneous level amplifier makes adjustments to the inductor current as
of VOUT will drop slightly, which will increase the voltage directed by the voltage error amplifier output via VC and is
level on VC by the inverting action of the voltage error commonly referred to as the inner current loop amplifier.
amplifier. When the increase on VC first occurs, the output The average current mode control technique is similar to
of the current averaging amplifier, ICOMP, will increase peak current mode control except that the average cur-
momentarily to command a larger duty cycle. This duty rent amplifier controls average current instead of the peak
cycle increase will result in a higher inductor current level, current. This difference eliminates the peak to average
ultimately raising the average voltage across RCS. Once current error inherent to peak current mode control, while
the average value of the voltage on RCS is equivalent to maintaining most of the advantages inherent to peak cur-
the VC level, the voltage on ICOMP will revert very closely to rent mode control. The inner loop compensation compo-
its previous level into the PWM and force the correct duty nents are fixed internally on the LTM4693 to simplify the
cycle to maintain voltage regulation at this new higher loop design and provide the highest possible bandwidth
inductor current level. The average current amplifier is over a wide operating range. However, the compensation
configured, so in steady state, the average value of the of the voltage loop is external for the LTM4693 which
voltage applied to its inverting input (voltage across RCS) allows the overall loop characteristics to be customized
will be equivalent to the voltage on its non-inverting input depending on the programmed output voltage, oscillator
VC. As a result, the average value of the inductor current frequency, output capacitance and equivalent ESR of the
is controlled in order to maintain voltage regulation. The output capacitors.
entire current amplifier and PWM can be simplified as a
Rev. 0
12 For more information www.analog.com
Page13
LTM4693
APPLICATIONS INFORMATION
The average current mode control used in the LTM4693 The voltage amplifier’s frequency response is designed to
can be conceptualized as a voltage controlled current optimize the response for the overall loop. Measurement
source (VCCS), driving the output load formed primarily of the power stage gain over line, load, component varia-
by RLOAD and COUT, as shown in Figure 4. tion, and frequency is strongly recommended prior to
The voltage error amplifier output (VC), provides a com- loop design. The design parameters for compensation
mand input to the V . As with peak current mode control, design will focus on the series resistor and capacitors
CCS
the inner average current control loop effectively turns the connected from VC to GND (RC, CC and CHF (Optional)).
inductor into a current source over the frequency range of Being a buck-boost converter, the target loop crossover
interest, resulting in a frequency response from the power frequency for the compensation design will be dictated
stage that exhibits a single pole (–20dB/decade) roll-off. by the highest boost ratio and load current as this will
The output capacitor (C ) and load resistance (R ) result in the lowest RHPZ frequency. The general goal
OUT LOAD
form a dominant low frequency pole, where the effective is to set the crossover frequency and provide sufficient
series resistance of the output capacitor and its capaci- phase boost using the external compensation network.
tance form a zero, usually at a high enough frequency to The LTpowerCAD design tool is available to download
be ignored, if ceramic capacitors are employed. online to perform loop compensation and transient
A potentially troublesome Right Half Plane Zero (RHPZ) optimization.
is also encountered if the converter is operated in boost Table 5 is provided for most application requirements.
mode. The RHPZ causes an increase in gain, like a zero,
but a decrease in phase, like a pole. This can ultimately Thermal Considerations and Output Current Derating
limit the maximum converter bandwidth that can be The thermal resistances reported in the Pin Configuration
achieved with the LTM4693. The RHPZ is not present section of the data sheet are consistent with those param-
when operating in buck mode. eters defined by JESD51-12 and are intended for use with
finite element analysis (FEA) software modeling tools that
g VIN > VOUT: 10A/V
m
VIN > VOUT: (10A/V) • (VIN/VOUT) leverage the outcome of thermal modeling, simulation,
VC and correlation to hardware evaluation performed on a
µModule package mounted to a hardware test board. The
VOUT VCCS 0.9V motivation for providing these thermal coefficients can be
found in JESD51-12 (“Guidelines for Reporting and Using
RESR R3 Electronic Package Thermal Information”).
1V + Many designers may opt to use laboratory equipment and
RLOAD FB V
– C a test vehicle such as the demo board to anticipate the
VOLTAGE RC C µModule regulator’s thermal performance in their appli-
COUT R4 ERROR HF
AMPLIFIER cation at various electrical and environmental operating
gm = 110µA/V CC conditions to compliment any FEA activities. Without
4693 F04 FEA software, the thermal resistances reported in the
Figure 4. Simplified Representation of Average Current Pin Configuration section are, in-and-of themselves, not
Mode Control Loop Small Signal Model relevant to providing guidance of thermal performance;
instead, the derating curves provided in the data sheet
can be used in a manner that yields insight and guidance
Rev. 0
For more information www.analog.com 13
Page14
LTM4693
APPLICATIONS INFORMATION
pertaining to one’s application usage, and can be adapted normal board-mounted applications, never does 100%
to correlate thermal performance to one’s own application. of the device’s total power loss (heat) thermally conduct
The Pin Configuration section typically gives three thermal exclusively through the top or exclusively through bottom
coefficients explicitly defined in JESD 51-12; these coef- of the µModule—as the standard defines for θJCtop and
ficients are quoted or paraphrased below: θJCbottom, respectively. In practice, power loss is ther-
mally dissipated in both directions away from the pack-
1. θJA, the thermal resistance from junction to ambient, age—granted, in the absence of a heat sink and airflow,
is the natural convection junction-to-ambient air ther- a majority of the heat flow is into the board.
mal resistance measured in a one cubic foot sealed
enclosure. This environment is sometimes referred Within the LTM4693 module, be aware there are multiple
to as “still air” although natural convection causes power devices and components dissipating power, with
the air to move. This value is determined with the a consequence that the thermal resistances relative to
part mounted to a four-layer demo circuit DC3016A. different junctions of components or die are not exactly
linear with respect to total package power loss. To rec-
2. θJCbottom, the thermal resistance from junction to oncile this complication without sacrificing modeling
bottom of the product case, is determined with all of simplicity—but also, not ignoring practical realities—an
the component power dissipation flowing through the approach has been taken using FEA software modeling
bottom of the package. In the typical module regu- along with laboratory testing in a controlled environment
lator, the bulk of the heat flows out the bottom of chamber to reasonably define and correlate the thermal
the package, but there is always heat flow out into resistance values supplied in this data sheet: (1) Initially,
the ambient environment. As a result, this thermal FEA software is used to accurately build the mechanical
resistance value may be useful for comparing pack- geometry of the µModule and the specified PCB with all
ages but the test conditions don’t generally match the of the correct material coefficients along with accurate
user’s application. power loss source definitions; (2) this model simulates
3. θ , the thermal resistance from junction to top of a software defined JEDEC environment consistent with
JCtop
the product case, is determined with nearly all of the JSED51-12 to predict power loss heat flow and tempera-
component power dissipation flowing through the top ture readings at different interfaces that enable the cal-
of the package. As the electrical connections of the culation of the JEDEC-defined thermal resistance values;
typical µModule are on the bottom of the package, it (3) the model and FEA software is used to evaluate the
is rare for an application to operate such that most of LTM4693 with heat sink and airflow; (4) having solved for
the heat flows from the junction to the top of the part. and analyzed these thermal resistance values and simu-
As in the case of θ , this value may be useful lated various operating conditions in the software model,
JCbottom
for comparing packages but the test conditions don’t a thorough laboratory evaluation replicates the simulated
generally match the user’s application. conditions with thermocouples within a controlled envi-
ronment chamber while operating the device at the same
A graphical representation of the aforementioned ther- power loss as simulated. An outcome of this process and
mal resistances is given in Figure 5; blue resistances are due-diligence yields a set of derating curves shown in
contained within the μModule regulator, whereas green this data sheet.
resistances are external to the µModule.
After these laboratory test have been performed and
As a practical matter, it should be clear to the reader that correlated to LTM4693 model, then the θJA is provided
no individual or subgroup of the three thermal resistance assuming approximately 100% of the power loss flows
parameters defined by JESD 51-12 or provided in the from the junction through the board into ambient with no
Pin Configuration section replicates or conveys nor- airflow or top mounted heat sink.
mal operating conditions of a μModule. For example, in
Rev. 0
14 For more information www.analog.com
Page15
LTM4693
APPLICATIONS INFORMATION
µModule DEVICE θJA JUNCTION-TO-AMBIENT RESISTANCE
θJCtop JUNCTION-TO-CASE CASE (TOP)-TO-AMBIENT
(TOP) RESISTANCE RESISTANCE
JUNCTION AMBIENT
θJCbot JUNCTION-TO-CASE CASE (BOTTOM)-TO-BOARD BOARD-TO-AMBIENT
(BOTTOM) RESISTANCE RESISTANCE RESISTANCE
4693 F05
Figure 5. Graphical Representation of JESD51-12 Thermal Coefficients, Including JESD 51-12 Terms
The 1.8V, 3.3V and 5V power loss curves in Figure 6 to loss as ambient temperature is increased. The monitored
Figure 8 can be used in coordination with the load current junction temperature of 120°C minus the ambient operat-
derating curves in Figure 9 to Figure 14 for calculating ing temperature specifies how much module temperature
an approximate θJA thermal resistance for the LTM4693 rise can be allowed. As an example in Figure 9, the load
with various heat sinking and airflow conditions. The current is derated to 1.5A at ~ 105°C with no air or heat
power loss curves are taken at room temperature, and sink and the power loss for the 3.3V to 1.8V at 1.5A output
are increased with multiplicative factors according to the is about 0.323W. The 0.388W loss is calculated with the
junction temperature. This approximate factor is: 1.2 for ~ 0.323W room temperature loss from the 3.3V to 1.8V
120°C at junction temperature. Maximum load current is power loss curve at 1.5A, and the 1.2 multiplying factor.
achievable while increasing ambient temperature as long If the 105°C ambient temperature is subtracted from the
as the junction temperature is less than 120°C, which is 120°C junction temperature, then the difference of 15°C
5°C guard band from maximum junction temperature of divided by 0.388W equals a 38.7°C/W θJA thermal resis-
125°C. When the ambient temperature reaches a point tance. Table 2 specifies a 38°C/W which is very close.
where the junction temperature is 120°C, then the load Table 2 to Table 4 provide equivalent thermal resistances
current is lowered to maintain the junction at 120°C while for 1.8V, 3.3V and 5V outputs with and without airflow.
increasing ambient temperature up to 120°C. The derating The derived thermal resistances in Table 2 to Table 4 for
curves are plotted with the output current starting at 2A the various conditions can be multiplied by the calcu-
and the ambient temperature at 30°C. The output voltages lated power loss as a function of ambient temperature to
are 1.8V, 3.3V and 5V. These are chosen to include the derive temperature rise above ambient, thus maximum
lower and higher output voltage ranges for correlating junction temperature. Room temperature power loss
the thermal resistance. Thermal models are derived from can be derived from the efficiency curves in the Typical
several temperature measurements in a controlled tem- Performance Characteristics section and adjusted with
perature chamber along with thermal modeling analysis. the above ambient temperature multiplicative factors. The
The junction temperatures are monitored while ambient printed circuit board is a 1.6mm thick four layer board
temperature is increased with and without airflow. The with two ounce copper for the two outer layers and one
power loss increase with ambient temperature change ounce copper for the two inner layers. The PCB dimen-
is factored into the derating curves. The junctions are sions are 76mm × 76mm.
maintained at 120°C maximum while lowering output cur-
rent or power with increasing ambient temperature. The
decreased output current will decrease the internal module
Rev. 0
For more information www.analog.com 15
Page16
LTM4693
APPLICATIONS INFORMATION
0.8 0.8 1.0
VIN = 2.6V VIN = 2.6V VIN = 2.6V
0.7 VIN = 3.3V 0.7 V 0.9
IN = 3.3V VIN = 3.3V
VIN = 5V VIN = 5V 0.8 VIN = 5V
0.6 0.6
0.7
0.5 0.5 0.6
0.4 0.4 0.5
0.3 0.3 0.4
0.3
0.2 0.2
0.2
0.1 0.1 0.1
0 0 0
0 0.5 1 1.5 2 0 0.5 1 1.5 2 0 0.5 1 1.5 2
LOAD CURRENT (A) LOAD CURRENT (A) LOAD CURRENT (A)
4693 F06 4693 F07 4693 F08
Figure 6. Power Loss at 1.8V Output Figure 7. Power Loss at 3.3V Output Figure 8. Power Loss at 5V Output
and 1MHz Switching Frequency and 1MHz Switching Frequency and 1MHz Switching Frequency
3.0 3.0 3.0
2.5 2.5 2.5
2.0 2.0 2.0
1.5 1.5 1.5
1.0 1.0 1.0
0.5 0LFM 0.5 0LFM 0.5 0LFM
200LFM 200LFM 200LFM
400LFM 400LFM 400LFM
0 0 0
25 50 75 100 125 25 50 75 100 125 25 50 75 100 125
TAMB (°C) TAMB (°C) TAMB (°C)
4693 F09 4693 F10 4693 F11
Figure 9. 3.3V to 1.8V Derating Figure 10. 3.3V to 3.3V Figure 11. 3.3V to 5V Derating
Curve, No Heat Sink Derating Curve, No Heat Sink Curve, No Heat Sink
3.0 3.0 3.0
2.5 2.5 2.5
2.0 2.0 2.0
1.5 1.5 1.5
1.0 1.0 1.0
0.5 0LFM 0.5 0LFM 0.5 0LFM
200LFM 200LFM 200LFM
400LFM 400LFM 400LFM
0 0 0
25 50 75 100 125 25 50 75 100 125 25 50 75 100 125
TAMB (°C) TAMB (°C) TAMB (°C)
4693 F12 4693 F13 4693 F14
Figure 12. 5V to 1.8V Derating Figure 13. 5V to 3.3V Derating Figure 14. 5V to 5V Derating
Curve, No Heat Sink Curve, No Heat Sink Curve, No Heat Sink
Rev. 0
16 For more information www.analog.com
LOAD CURRENT (A) LOAD CURRENT (A) POWER LOSS (W)
LOAD CURRENT (A) LOAD CURRENT (A) POWER LOSS (W)
LOAD CURRENT (A) LOAD CURRENT (A) POWER LOSS (W)
Page17
LTM4693
APPLICATIONS INFORMATION
SAFETY CONSIDERATIONS LAYOUT CHECKLIST/EXAMPLE
The LTM4693 modules do not provide galvanic isolation The high integration of LTM4693 makes the PCB board
from VIN to VOUT. There is no internal fuse. If required, layout very simple and easy. However, to optimize its
a slow blow fuse with a rating twice the maximum input electrical and thermal performance, some layout consid-
current needs to be provided to protect each unit from erations are still necessary.
catastrophic failure. The device does support thermal
shutdown and short-circuit protection.
Table 2. 1.8V Output
DERATING CURVE VIN (V) POWER LOSS CURVE AIR FLOW (LFM) HEAT SINK θJA (°C/W)
Figure 9, Figure 12 3.3, 5 Figure 6 0 None 38
Figure 9, Figure 12 3.3, 5 Figure 6 200 None 34
Figure 9, Figure 12 3.3, 5 Figure 6 400 None 34
Table 3. 3.3V Output
DERATING CURVE VIN (V) POWER LOSS CURVE AIR FLOW (LFM) HEAT SINK θJA (°C/W)
Figure 10, Figure 13 3.3, 5 Figure 7 0 None 38
Figure 10, Figure 13 3.3, 5 Figure 7 200 None 34
Figure 10, Figure 13 3.3, 5 Figure 7 400 None 34
Table 4. 5V Output
DERATING CURVE VIN (V) POWER LOSS CURVE AIR FLOW (LFM) HEAT SINK θJA (°C/W)
Figure 11 ,Figure 14 3.3, 5 Figure 8 0 None 38
Figure 11 ,Figure 14 3.3, 5 Figure 8 200 None 34
Figure 11 ,Figure 14 3.3, 5 Figure 8 400 None 34
Rev. 0
For more information www.analog.com 17
Page18
LTM4693
APPLICATIONS INFORMATION
Table 5. Output Voltage Response vs Component Matrix
COUT VALUE PART NUMBER
MURATA 22µF ×2, 25V, 1210, X5R GRM32ER61E226ME15L
LOAD STEP P-P RECOVERY
VIN VOUT fSW COUT LOAD STEP SLEW RATE DERIVATION TIME
(V) (V) (MHz) (CERAMIC) COMPENSATION (A) (A/µs) (mV) (µs)
2.6 5 1 22µF ×2 CTH = 2.2nF, RTH = 10k 1A – 1.5A 0.5 500 200
3.3 1.8 1 22µF ×2 CTH = 2.2nF, RTH = 10k 1A – 2A 1 180 70
3.3 3.3 1 22µF ×2 CTH = 2.2nF, RTH = 10k 1A – 2A 1 310 95
5 3.3 1 22µF ×2 CTH = 2.2nF, RTH = 10k 1A – 2A 1 270 95
5 5 1 22µF ×2 CTH = 2.2nF, RTH = 10k 1A – 2A 1 500 170
Rev. 0
18 For more information www.analog.com
Page19
LTM4693
APPLICATIONS INFORMATION
• Use large PCB copper areas for high current paths, • Do not put via directly on the pad, unless they are
including VIN, GND and VOUT. It helps to minimize the capped or plated over.
PCB conduction loss and thermal stress. • Bring out test points on the signal pins for monitoring.
• Place high frequency ceramic input and output capaci- Figure 15 gives a good example of the recommended layout.
tors next to the VIN, GND and VOUT pins to minimize
high frequency noise.
• Place a dedicated power ground layer underneath
the unit.
• To minimize the via conduction loss and reduce module
thermal stress, use multiple vias for interconnection
between top layer and other power layers.
GND
CIN1 CIN2 COUT1 COUT2
VIN VOUT
GND
4693 Fxx
Figure 15. Recommended PCB Layout
Rev. 0
For more information www.analog.com 19
Page20
Typical Applications、Package Description
LTM4693
TYPICAL APPLICATIONS
SW1 SW1 SW1 SW2 SW2 SW2
VIN VOUT
2.6V to 5.5V VIN VOUT 3.3V/1.5A
CIN COUT
22µF VIN VOUT (2A AT BUCK)
22µF
VIN VOUT
SS LTM4693
26.2k
FREQ FB
MODE/SYNC
RUN/UVLO COMP
GND GND GND GND GND GND GND 10k
2.2nF
4693 TA02
Figure 16. 2.6V to 5.5V Input, 3.3V Output with Minimum Components (Default 2ms Soft-Start Time and 1MHz Switching Frequency)
SW1 SW1 SW1 SW2 SW2 SW2
VIN VOUT
2.6V to 5.5V VIN VOUT 1.8V/2A
CIN C
22µF VIN V OUT
OUT 100µF
VIN VOUT
SS LTM4693
75.5k
FREQ FB
0.1µF
110k MODE/SYNC
RUN/UVLO COMP
GND GND GND GND GND GND GND 10k
VIN
2.2nF
4693 TA03
Figure 17. 2.6V to 5.5V Input, 1.8V Output with Adjustable SS Time and 2MHz Switching Frequency
PACKAGE DESCRIPTION
LTM4693 LGA Pinout
PIN ID FUNCTION PIN ID FUNCTION PIN ID FUNCTION PIN ID FUNCTION PIN ID FUNCTION
A1 GND A2 SW1 A3 GND A4 SW2 A5 GND
B1 GND B2 SW1 B3 GND B4 SW2 B5 GND
C1 VIN C2 SW1 C3 GND C4 SW2 C5 VOUT
D1 VIN D2 VIN D3 SS D4 VOUT D5 VOUT
E1 RUN/UVLO E2 MODE/SYNC E3 FREQ E4 FB E5 COMP
Rev. 0
20 For more information www.analog.com