


生細胞解析に携わる研究者の方に!がん研究や免疫学、ニューロサイエンスなどの新アッセイをご紹介
生細胞解析に携わる研究者の方に向け、当社の最新アプリケーションを紹介した資料『ライブセル解析ハンドブック』を進呈中です。
前版からのデジタルアップグレードを継承しつつ、組み込みオルガノイドアッセイの新セクションや、ファゴサイトーシスアッセイなどの新データを追加。また、ラベルフリー細胞解析に関するチャプターも追加収録しています。
全342ページの大ボリューム。より効率的に実験を行うためのヒントが満載です。
【本ハンドブックについて】
“Incucyteライブセルアッセイ”を用いた様々なアプリケーションのための専用のチャプターを設け、ライブセル解析について詳しく解説しています。
※「PDFダウンロード」より英語版資料をスグに入手いただけます。
資料でご紹介している製品に関しても、お気軽にお問い合わせください。
このカタログについて
| ドキュメント名 | 英語版 第5版『ライブセル解析ハンドブック』<資料進呈> |
|---|---|
| ドキュメント種別 | ハンドブック |
| ファイルサイズ | 35.6Mb |
| 登録カテゴリ | |
| 取り扱い企業 | ザルトリウス・ジャパン株式会社 (この企業の取り扱いカタログ一覧) |
この企業の関連カタログ


このカタログの内容
Page1
Live-Cell Analysis Handbook
A Guide to Real-Time Live-Cell Imaging and Analysis
Fifth Edition
Page2
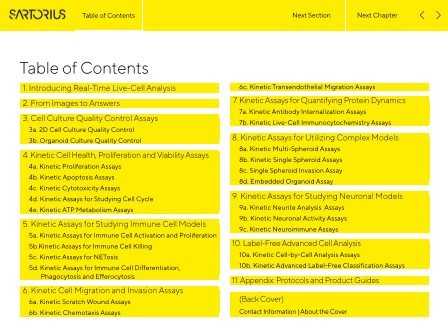
Table of Contents
Table of Contents
Page3
Chapt 1: Introducing Real-Time Live-Cell Analysis
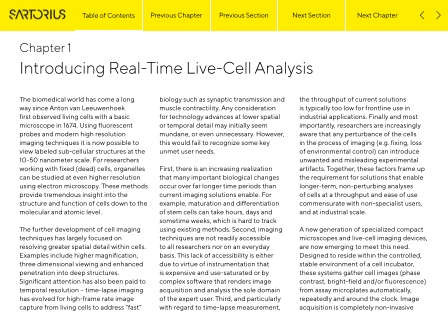
Chapter 1
Introducing Real-Time Live-Cell Analysis
The biomedical world has come a long biology such as synaptic transmission and the throughput of current solutions
way since Anton van Leeuwenhoek muscle contractility. Any consideration is typically too low for frontline use in
first observed living cells with a basic for technology advances at lower spatial industrial applications. Finally and most
microscope in 1674. Using fluorescent or temporal detail may initially seem importantly, researchers are increasingly
probes and modern high resolution mundane, or even unnecessary. However, aware that any perturbance of the cells
imaging techniques it is now possible to this would fail to recognize some key in the process of imaging (e.g. fixing, loss
view labeled sub-cellular structures at the unmet user needs. of environmental control) can introduce
10-50 nanometer scale. For researchers unwanted and misleading experimental
working with fixed (dead) cells, organelles First, there is an increasing realization artifacts. Together, these factors frame up
can be studied at even higher resolution that many important biological changes the requirement for solutions that enable
using electron microscopy. These methods occur over far longer time periods than longer-term, non-perturbing analyses
provide tremendous insight into the current imaging solutions enable. For of cells at a throughput and ease of use
structure and function of cells down to the example, maturation and differentiation commensurate with non-specialist users,
molecular and atomic level. of stem cells can take hours, days and and at industrial scale.
sometime weeks, which is hard to track
The further development of cell imaging using existing methods. Second, imaging A new generation of specialized compact
techniques has largely focused on techniques are not readily accessible microscopes and live-cell imaging devices,
resolving greater spatial detail within cells. to all researchers nor on an everyday are now emerging to meet this need.
Examples include higher magnification, basis. This lack of accessibility is either Designed to reside within the controlled,
three dimensional viewing and enhanced due to virtue of instrumentation that stable environment of a cell incubator,
penetration into deep structures. is expensive and use-saturated or by these systems gather cell images (phase
Significant attention has also been paid to complex software that renders image contrast, bright-field and/or fluorescence)
temporal resolution – time-lapse imaging acquisition and analysis the sole domain from assay microplates automatically,
has evolved for high-frame rate image of the expert user. Third, and particularly repeatedly and around the clock. Image
capture from living cells to address “fast” with regard to time-lapse measurement, acquisition is completely non-invasive
Page4
and non-perturbing to cells, opening up issues (non-flat optical components and Sartorius). The consistency with which
the opportunity to capture the full, and illumination imperfections) or undesired images are acquired and processed
as needed, long-term time course of the signal introduced by the sample are strongly influences the ability to analyze
biology. Acquisition scheduling, analysis common issues. Autofluorescence from the collected data. This can be a time-
and data viewing can be conducted easily cellular components or media, or non- consuming task, and purpose-built
and remotely, without in-depth knowledge biological signal sources such as shading, software that presents only the tools
of image processing. Data is analyzed on or patterns arising from sample matrices or necessary for a specific scientific question
the fly, image by image, to provide real-time non-uniform illumination due to meniscus can remove what can be a significant
insight into cell behavior. We refer to this effects in microwells must be removed hurdle in the image analysis workflow.
paradigm, which is differentiated from before usable, replicable information can be
straight live-cell imaging by the provision of extracted. While traditional compact microscopes
analysed data at scale as opposed to simply typically only image from a single micro-
images, as ‘real-time live-cell analysis’. In order to perform these corrections, plate or flask at a time, new live-cell
one must be aware of the effects of each analysis devices such as Incucyte® can
In an ideal world, the images acquired from a process, and manipulations on the raw automatically capture and analyze
live-cell imaging device would be collected images must be repeatable, to ensure images from multiple microplates in
only from photons produced by the sample faithful capture of the measured biological parallel, thereby significantly increasing
of interest, and in perfect focus. However, signal across images, experiments, throughput (e.g. Incucyte = 6 x 384 well
this is not the usual case. There are multiple and devices. There are many tutorials plates). With the Incucyte® Live-Cell
sources of confounding signal present in an and software toolkits available to Analysis System, a unique moving optical
image, each needing correction, removal, or process images, however systems that path design means that the cells and cell
cleaning in order to reveal information which perform these corrections as a matter plates remain stationary throughout the
has been generated by the sample elements of course provide consistency and entire experiment. This further minimizes
of interest. Corrections are needed due ease of use, particularly when coupled cell perturbance and enables imaging
to systematic aberrations in an imaging with standardized assays, reagents and analyses of both adherent and non-
system stemming from multiple sources. For and consumables which normalize the adherent cell types.
example, detector anomalies (e.g. detector experimental process (e.g. the Incucyte®
bias, dark current variability, field flatness Live-Cell Analysis System, and the This combination of functionality,
and thermal or gamma-ray noise), optical assays and reagents available from throughput and ease of use revolutionizes
Page5
the way researchers can think about monitored throughout the cell culture also be guided. Drug washout studies
imaging assays in living cells. Real-time period and immediately post-seeding on may be performed using the real-time
live-cell analysis has now been applied the micro-titer assay plate. The parameter/ data to identify when an equilibrium
to a wide range of phenotypic cellular phenotype of interest can be measured response occurs and to trigger the timing
assays including cell proliferation, cell prior to the addition of treatments to of the washout regime. If for any reason
death and apoptosis, immune-cell killing, provide a within well baseline measure. it transpires that the experiment is not
migration, chemotaxis, angiogenesis, Quality control of cells and assay performing as expected, then treatments
neurite outgrowth and phagocytosis. In plates in this way helps improve assay could be withheld to save expensive
each case, the full time-course data and performance and consistency by ensuring reagents and follow-on experiments can
‘mini-movies’ of the assay provide greater that experiments are only conducted on be initiated more quickly to make up time.
biological insight than end point assays. healthy, evenly plated cultures with the
Novel analyses such as area under curve, expected cell morphology. Real-time live-cell analysis is extremely
time to signal onset or threshold, and rate helpful when developing, validating
parameters (dx/dt) are at times highly The real-time live-cell analysis approach and troubleshooting phenotypic assays.
value adding. Simply calculating the assay also provides the opportunity to make Within a small number of assay plates
signal at its peak time-point and/or at data driven decisions while the experiment it’s usually possible to obtain a clear
the optimal signal/background all helps is in progress. A researcher studying the understanding of the relationship over
in assembling robust and reproducible biology of vascular or neuronal networks, time between assay signal and treatments,
assays. Of course, transient effects of for example, may wish to first establish cell plating densities, plate coatings and
treatments can be detected by kinetic a stable network before assessing the other protocol parameters. Scrutiny of
imaging that may otherwise be missed with effects of compound treatments or the kinetic data and ‘mini-movies’ from
end-point reads. genetic manipulations (e.g. siRNAs). each well help to rapidly pinpoint sources
With continuous live-cell analysis, it of within- and across-plate variance and
Due to its non-invasive nature, is straightforward to temporally track to validate the biology of interest. This is
measurements from cells can be made network parameters and use the real time particularly true for more advanced cell
not only during the assay itself but also data to judge when best to initiate the systems such as co-cultures where far
during the cell preparation and ‘pre-assay’ treatment regimes. The timing of adjunct more permutations and combinations of
stage. For example, the morphology studies such as analysis of metabolites protocol parameters exist (e.g. cell plating
and proliferation rates of cells can be or secreted proteins in supernatants can ratios) and the biology is more complex.
Page6
In summary, real-time live-cell analysis is re-
defining the possibilities and workflows of
cell biology. The combination of ease of use,
throughput, long term stability and non-
invasive measurement enables researchers
to monitor and measure cell behaviors at a
scale and in ways that were previously not
possible, or at the least, highly impractical.
In the following chapters of this handbook,
we illustrate this with a range of different
application examples.
Page7
Chapt 2: From Images to Answers
Chapter 2
From Images to Answers Sample Image V- isualiza and Preprocessing
- ion
t
Assess data.
Introduction - Correct image defects.
Bleaching.
R
The nature of cell biology research typically requires - estoration and Reconstruction
that image-based methods are used to capture -
moments in time to enable comparisons between User Driven
treatment groups and across imaging modalities. or Automated
Sample information is typically acquired using - Restore useful information.
Kernal filtering.
Specify Features
a microscope and a digital camera, and those - Suppress noise.
Identify regions of interest.
moments in time are processed and analyzed. Images A
The Image
captured with a typical microscope camera are digital ract parameters like area,
representations of the analog information contained Processing - nalysis
Ext
overlap, object number.
in the sample, providing a means to automatically Workflow
analyze the information in the sample. Once these C
digital snapshots are acquired, image processing is
used to clean up the data, and image analysis is used - lassification
to extract usable information for analysis. Figure 1. Image processing and analysis is- Group objects into different classes.
Display population data.
accomplished using a number of
At the core of all of these manipulations are numbers – techniques, guided by expert knowledge and software guidance. To ensure
images are comprised of pixels (picture elements), and processing consistency across static and kinetic data, it is important to establish
each pixel in an image has a digital value representing a set of image processing parameters which enable operation on all images
the brightness or intensity of that portion of the in an identical manner. This contextually derived data processing workflow will
sample, at a specific moment in time. By operating on seamlessly and automatically perform all of the necessary pre- and post- image
these values, either in isolation, or while considering processing steps, up to and including object analysis and graphical representa-
nearby values, the information in the images can be tion of the experimental result. Properly designed image analysis workflows are
cleaned of aberrant information, and data relevant to intended to require no human intervention and processes image archives, gen-
the imaged sample can be extracted and measured. erating consistent and actionable results either in real-time, or post-acquisition.
Page8
Previous Section
Performing these steps on individual Image Processing to Remove introduced by the sample are common
images to generate sufficient statistical Systematic or Sample-Induced issues. Autofluorescence from cellular
power to support a hypothesis can components or media, or non-biological
be a tedious process. However, Artifacts signal sources (i.e. shading or patterns
when operating on large numbers of arising from sample matrices, micro-fluidic
images which have been collected in a The image data we have described above channels, or non-uniform illumination
substantially similar manner, the series is typically captured by detectors that effects in microwells) must be removed
of operations performed to clean up the convert analog information, specifically before usable, replicable information can
data, extract desired information, and photons, into digital signals. This analog be extracted.
compare images may be recorded and information is collected in a matrix fashion,
automatically applied to many images in spatially rendered according to location in In order to perform these corrections,
a single experiment. Once this data has the sample. Ideally, the signal undergoing one must be aware of the effects of each
been extracted, treatment groups may analog to digital conversion would come process, and manipulations on the raw
be compared to assess differences, and only from photons produced by the sample images must be repeatable to ensure
hypotheses evaluated. Scaling this to the of interest, and in perfect focus. However, faithful capture of the true biological
analysis of live-cell experiments allows this is not the usual case. There are multiple signal across images. There are many
for the evaluation of temporal data, and sources of confounding signal present in an tutorials and software toolkits available
extending this to microplate microscopy image, each needing correction, removal, to process images, however systems that
means that population data may be or cleaning in order to reveal information perform these corrections as a matter
studied with ease. This basic workflow which has been generated by the sample of course provide consistency and
is the subject of countless tutorials and elements of interest. Corrections are ease of use, particularly when coupled
books, and the domain of numerous needed due to systematic aberrations with standardized assays, reagents
software packages that offer a cornucopia in an imaging system stemming from and consumables which normalize the
of tools intended to answer a broad range multiple sources. For example, detector experimental process (e.g. the Incucyte®
of scientific questions. anomalies (e.g. detector bias, dark current Live-Cell Analysis System, and the assays
variability, field flatness and thermal or and reagents available from Sartorius).
gamma-ray noise), optical issues (non- The consistency with which images are
flat optical components and illumination acquired and processed will influence the
imperfections) or undesired signal ability to analyze the collected data.
Page9
Previous Section
Identifying Biology Generating Actionable Data of labels, image processing, and object
of Interest via Image Masking identification can require deep technical
expertise, as the number of options
or “Segmentation” After the pixels which satisfy all of the available to differentiate objects is very
measurement criteria are identified in broad. For example, if you are looking for
Once an image has been appropriately an image, it is possible to operate on all red-labeled nuclei that are also labeled
processed to remove aberrant signal, this binary mask of pixels. The mask may with a green reagent (e.g. apoptotic cells
the next step is to identify the biology of be analyzed whole (for total area, or labeled with Incucyte® Caspase 3/7 Green
interest. Image segmentation is a binary confluence measurements) or broken Dye), it is possible to identify individual
process, meaning pixels are classified into multiple subparts, for example cells first using a transmitted light image
as either “in” and are included in any when defining or counting objects in the [mask 1], breaking that mask into objects
enumeration process, or “out” and not image. Depending upon the labeling of representing cells using image processing
considered as part of the sample. The the sample, e.g. label-free or tagged with tools like watershed split, and then
simplest method for determining which a specific marker such as a fluorescent classifying those objects/cells based on
pixels are in or out is by thresholding, reagent labeling a specific organelle or the included red and green mean intensity
or setting a boundary above which all structure, a wide variety of statistics may of the included nuclei. This task is more
pixels are “in”, and below which, all pixels be generated. In the case of fluorescent easily performed when the scientific
are “out”. More complex tools do exist, reagent-labeled images, these statistics question is well-defined, the appropriate
and more complex interactions can be may include the mean intensity value tools are utilized, and the images
performed with multiple masks, and of all the pixels in the mask, the total processed automatically, and without bias.
Boolean operations (e.g., AND, OR, NOT) additive intensity, the minimum, maximum,
in order to hone in on the exact pixels or standard deviation of the collective
of scientific interest. Again, this can be a intensity, or the fluorescence mask may
time-consuming task, and purpose-built be used to count numbers of objects.
software that presents only the tools Statistics may be global for the image as
necessary for a specific scientific question just described (e.g. total size of the mask,
can remove what can be a significant or mean intensity of the mask) or per
hurdle in the image analysis workflow. object (e.g., area occupied by individual
cells).Once again, the appropriate choice
Page10
Previous Section
Analyzing Image Data at Throughput
Now that a specific set of operations variability between images in different
has been constructed to process and treatment groups and at different time
analyze a representative image, this same points should be expected. In analyzing a
set of operations may be applied to all large image set, one must be assured that
images in an experiment in exactly the the set of operations is suitable across
same manner. If this set of operations the data set (e.g., on dead or living cells).
inadequately processes the population of Traditional image analysis software does
images included in an experiment, it may not offer the ability to assess a variety of
be necessary to make adjustments to the images in an efficient manner, and thus
set of processing operations based upon typical live-cell microplate assays can be
the population of images collected for unwieldy, at best. Software must address
the task. In a live-cell imaging experiment the needs of the researcher by performing
performed in a 96-well plate, a data all the steps required to convert images to
set containing thousands of images is data at the scale of long-term time-lapse
perfectly reasonable. Many data sets will experiments, and at the rate of acquisition,
be considerably larger when capturing in order to best understand biological
multiple channels, e.g. red fluorescence/ processes while they are happening.
green fluorescence/transmitted light, so
Page11
Chapt 3: Cell Culture Quality Control Assays
Chapter 3
Cell Culture Quality Control Assays
Real-Time Monitoring and Analysis of Cell Culture Conditions
The ultimate goal of in vitro cell culture
is for the downstream analysis of cells for - Poor CO2 incubator performance due contamination by infectious agents and
to lack of calibration and stability of cross contamination with other cell types.
the characterization of their biological temperature, humidity and CO2 over
changes for deeper understanding
as well as the development of novel
therapeutics. However, the importance - time. Each of these controllable variables can
Non-quantitative and/or inconsistent adversely affect the results of data obtained
procedures for feeding and splitting from downstream analyses, leading to
of careful analysis of cells during culture cell cultures prior to running cell-based misinterpreted data, a waste of valuable
maintenance is often overlooked. With assays including inconsistent limits of resources and time, and ultimately delaying
the advancement of cell models occurring cell density and feeding schedules, insight and the development of innovative
rapidly and the promise of personalized inconsistent cell density at the time of therapies. A key element in controlling
medicine, the ability to monitor cells at
every step of the cell culture workflow
is necessary, as the quality of basic cell - assay and changes to cell morphology. adverse variables is to standardize
workflow and metrics, thereby eliminating
Alterations in media components due human subjectivity and interpretation.
culture maintenance ultimately affects the to lot-to-lot differences and alteration Advantages of performing quality control
quality of the subsequent data. of concentrations over time due to of cell cultures via continuous monitoring
- degradation. The Incucyte® Live-Cell Analysis System
Many sources of cell culture variability Differences in cell culture growth provides a label-free, non-invasive method
are largely uncontrollable because they surfaces such as variability among for monitoring cells directly in the incubator,
are inherent to the stochastic processes suppliers, vessel surface treatments and for both cultures grown in two- and three-
in biological systems. However, a large
number of controllable environmental
variables exist that can alter the growth - lot-to-lot variability. dimensional planes. In sharp contrast to
Biological issues resulting from manual monitoring of cell culture processes,
growing cells in continuous culture for quality control monitoring with real-time
and function of cells in culture. Some key extended periods of time which in turn live-cell analysis automates data capture
controllable factors include: increases the risk of phenotypic drift, and cell assessment (Figure 1). Cells can be
Page12
monitored around-the-clock and at precise, samples and complex organoids, is the Live-Cell Imaging and Analysis
regularly scheduled sampling intervals. In ability to monitor these cultures while they Approaches for Quality Control
addition to supporting decisions for current are maintained in a physiologically relevant
culture processes, historical information environment. Combining unbiased analysis Assays
can be retrieved months or years later for within a stable environment facilitates The Incucyte® Live-Cell Analysis System is
comparison of cell lines and culture growth downstream assay reproducibility, through compatible with multiple different types of
characteristics. Of significant importance, automated analysis of cells as they grow in cell culture vessels and can monitor multiple
as cell models move to patient specific culture. vessels and cell models at a time. Data
Manual Cell Culture Monitoring
Initial cell Assessments made at random Cell utilization decisions
measurements— locations with variable including timing—
subjective. frequencies— qualitative and subjective.
operator dependent.
Initiate Culture Monitor Growth Utilize Cells Time
Initial cell Assessments made at precise Passage, treatment, harvest
measurements— locations with scheduled or assay imitation decisions
made for sampling intervals— based on data-driven,
every well. objective morphological quantitative measurements.
and growth analysis support
Live-Cell Analysis decisions.
Figure 1. Comparison of cell culture monitoring methods. Vertical arrows represent interaction points with the cell culture using manual
methods and real-time live-cell analysis. Subjective decisions made during manual monitoring result in variability for cell-based assays.
Page13
consists of objective, image-based growth growth over time using cell confluence
metrics to capture transient and time- curves. Using these basic confluence
dependent events. Purpose built software is metrics or the more advanced Incucyte®
employed to identify cells, in both 2D and 3D Cell-by-Cell Analysis Software Module
cultures to accurately identify morphology to individually identify label-free cells,
and proliferation over time. Building on non-adherent or adherent cultures can
our knowledge of image acquisition and be accurately evaluated for changes in
analysis, innovative image strategies were proliferation and morphology.
employed to accurately identify and quantify
3D organoids using the Incucyte® Organoid Organoid Quality Control
Analysis Software Module. Incucyte® To monitor and make informed decisions
Live-Cell Quality Control Assays allows about organoid culture status, the
for automatic analysis to enable real time Incucyte® Organoid Analysis Software
decisions on culture status. Module automatically locates and analyzes
organoids within Matrigel® domes. The
How Live-Cell Quality Control software uses image-based, kinetic
Assays Work analysis of count, size and morphology to
enable informed decision on culture status
Cell Culture Quality Control (2D) to identify optical culture conditions. Of
critical importance is the ability to quantify
The Incucyte® Live-Cell Analysis System
and the visualize the differentiation and
provides a label-free, non-invasive
maturation of organoids in 24- or 48-well
approach to long term monitoring of
plates, all while keeping these sensitive
cell morphology and growth without
organoids within the stable environment of
removing cells from the incubator.
a tissue culture incubator.
Integrated analysis software provides
phase segmentation metrics that track cell
Page14
Chapt 3A: 2D Cell Culture Quality Control
3a
2D Cell Culture Quality Control
Introduction - Documentation of Cell Morphology
Changes in cell morphology due to cell - Documenting Time-Dependent
In order to establish quality cell cultures ty or phenotypic drift can Variables
seeding densi Assessment of cell behavior and growth in
and improve experimental outcomes in be identified using a range of magnifica- association with cell treatment times can
downstream assays, various aspects of tions to capture fine details of cells and define experimental conditions to ensure
cell culture need to be tightly controlled, spatial coverage of cell populations. consistent results.
optimized and documented. Accurate Assessment of Overall
- - Monolayer With the Incucyte® Cell Culture Quality
Growth Conditions By imaging multiple areas of your vessel Control Assay, routine cell culture methods
Prior to utilizing cells in quantitative or using a whole-well imaging mode, can be observed and monitored in a non-
assays, it is important to optimize spatial variations in cell distribution can invasive, quantitative way that will lead
and define cell culture regimens. nd then reduced. improve the quality and consistency of cell
Documenting variations in cell growth Cell Seeding Densities based assays.
due to factors such as; lot-to-lot - be quantified a
To improve assay quality and consistency
differences in cell culture media, changes of kinetic assays, it is important to mini-
in media component concentrations mize variations in cell seeding densities
over time due to degradation, and due to pipetting errors during plate
inconsistent feeding schedules can all be seeding which result in differential growth
identified using label-free phase image rates. Measuring confluence before utiliz-
segmentation techniques that generate ing assay plates eliminates assay variation,
confluence measurements. resulting in reproducible conditions.
Page15
Incucyte® 2D Cell Culture Quality Shortcomings of Live-Cell Imaging
Control Assays at a Glance
The Incucyte® Live-Cell Analysis System
and 2D Cell Culture QC Assay provide a -Traditional Assays and Analysis Approaches
Lack of environmental control and - Uninterrupted environmental control
physical movement of plate during provided by a tissue culture incubator,
label-free, non-invasive method in which analysis. coupled with a label-free and
researchers can optimize and define cell automated image acquisition without
culture regimes. Conducted completely
within the tissue culture incubator, HD
phase contrast images are collected - needing to disturb cell.
Data obtained from a concatenated
single time point yields minimal - Cells are measured continuously over
time via repeated interrogation of the
from the culture vessel of choice, such dynamic insight and causes variability same well, providing insight into how
as microtiter plates, tissue culture flasks, in assay results. conditions such as cell seeding artifacts
and dishes, in order to visualize and
quantify cell proliferation in various culture
conditions. Multiple areas of the vessel - impact cell growth.
Indirect detection methods are
subject to artifacts that cannot be - True, direct measurements of cell
confluence are generated non-
can be imaged, or whole-well imaging readily verified by eye. invasively and visually verified via
can be used to highlight spatial variations image and movies.
and optimize cell distribution using
quantitative metrics. With fully integrated
software algorithms, label-free phase Table 1. Shortcomings of Traditional Assays vs Live-Cell Imaging and Analysis Approaches.
segmentation metrics track cell growth
over time using cell confluence curves
or direct label-free cell counts using the
Incucyte® Cell-by-Cell Analysis Software
Module. With the 2D Cell Culture QC
Assay, cell-type specific culture conditions
and growth characteristics can be defined.
Page16
Cell Culture QC Assays
Measuring Proliferation to Optimize Growth
Conditions and Seeding Densities
The Incucyte® Live-Cell Analysis System can be
used to track cell proliferation over time from various
regions within a tissue culture flask or plate, as shown
Figure 1. Incucyte® Vessel
in Figure 1. Integrated software provides label-free
View shows location of images
phase segmentation (confluence) metrics (Figure 2),
acquired and displays desired
allowing for the assessment of cell growth as well as
metric like Phase Confluence
monitoring cell culture and assay optimization.
(%) on images for quick
evaluation of cell distribution.
6 Hours 24 Hours 48 Hours Phase Confluence
100%
80
60
40
20
0
0 20 40 60
Time (hours)
Figure 2. HD phase contrast images of HT-1080 human fibrosarcoma cells (confluence mask overlaid) with proliferation time-course.
Page17
In a study to assess different culture effect on proliferation was found based on in Figure 4. In 4A and 4B, the variation
conditions (Figure 3), HUVEC cells were confluence curves. Additionally, HT-1080 in cell seeding density-dependent
cultured in basal cell media supplemented cells exhibited different growth curves proliferation in two different cell lines,
with decreasing concentrations of fetal dependent on the initial seeding density. A172 human glioblastoma and LNCap
bovine serum (FBS). Additionally, HT- Gaining a better understanding of these human prostate carcinoma, is exemplified.
1080 cells were seeded at initial seeding culture conditions can help to optimize Understanding cell seeding variation and
densities ranging from 5000-30000 cells/ and define cell culture protocols. its effects on proliferation is important for
well. Using Incucyte® integrated analysis controlling assay variability. As shown in
software, images were automatically Live-cell analysis can be used to accurately 4C, images reveal accurate segmentation
acquired and analyzed over time. In the mask different morphologies and quantify of cell types irrespective of morphology.
HUVECs, a concentration dependent label-free proliferation over time, as shown
Confluence 10% FBS Confluence
100% 5% FBS
2.5% FBS 100% 30K
1.25% FBS
80 80
0.625% FBS 20K
60 0.312% FBS 60
0.156% FBS 10K
40
5K
40
20
Serum Free
20 0
0 6 12 18 24 30 36 42 48 54 60 66 0 24 48 72
Time (hours) Time (hours)
Figure 3. Human umbilical vein endothelial cells (HUVECs) cultured in basal cell media containing growth factors and supplemented with
decreasing amounts of FBS. The optimal concentration of FBS for normal propagation was determined to be >2.5%. Different initial seeding
densities were also tested and shown to have an effect on HT-1080 growth curves.
Page18
A Confluence C A549 (6 hours) HT-1080 (24 hours) LNCap (72 hours)
100%
20K
80 15K
60 10K
40 5K
2K
20 1K
0
0 24 48 72 96
Time (hours)
B Confluence
100%
20K
80 15K
60 10K
40 5K
2K
20 1K
0
0 24 48 72 96
Time (hours)
Figure 4. Quantification of A549 (A) and MCF-7 (B) growth curves using label-free confluence analysis. HD phase contrast images (C) of A549
human lung carcinoma, HT-1080 human fibrosarcoma and LNCap cells shown without and with confluence mask (orange). Images reveal
accurate confluence masking of all three cell types of varied morphology.
Page19
A 24 hours 62 hours B Growth vs. Time—Untreated CHO Cells
Confluence 24–Well Plate—Quality Control Check
100%
90
Well D5 80
70
60
50
40
30
20
10
Well A2 0
0 9 18 27 36 45 54 63
T6i2m heo (u hrosurs)
A1 A2 A3 A4 A5 A6 B1 B2
B3 B4 B5 B6 C1 C2 C3 C4
24 hours 62 hours C5 C6 D1 D2 D3 D4 D5 D6
Figure 5. Images (A) and data (B) illustrating the Conclusions
effect of pipetting errors on growth. Wells were
seeded at the same cell density and then checked
prior to an endpoint assay for growth. Initial With real-time live-cell analysis, it is possible to follow and quantify
confluence for four wells were found to be ~50% cell growth over time, effectively revealing both transient and time-
that of the median initial confluence for the plate, a dependent phenomena. This type of analysis is a powerful tool for
variable likely caused by pipetting errors. cell culture quality control, providing a quantitative, objective, non-
invasive and kinetic method of analyzing living cells, unperturbed
in the incubator. Use of the Incucyte® Live-Cell Analysis System to
document and monitor routine cell culture can improve cell-based
assay quality and consistency.
Page20
Chapt 3B: Organoid Culture Quality Control
3b
Organoid Culture Quality Control
Kinetic Analysis of Organoid Culture Status Within Matrigel® Domes
Introduction of 3D collections of cells that resemble unprecedented potential for various,
an organ or human tissues in vivo, have innovative applications. However, in order
In vitro 3D cultures have opened up new emerged as the ideal model. Advances in to exploit these models for meaningful
horizons for translational human disease making and monitoring organoids have basic research, disease modelling and drug
research, disease modelling, regenerative improved drug discovery workflow and screening, specific and reliable culture and
medicine and predictive precision disease modelling, leading to increased analysis methods are required. Currently,
therapies. Significant progress has been productivity and faster discovery of new characterization and optimization of
made towards translational cell models and treatments. In using in vitro organoid and organoid cultures are limited in their ability
today, differentiated organ cell types can spheroid culture methods, researchers to reproducibly form and monitor these 3D
be generated in vitro from a variety of stem are making the shift to more translational structures as they form and grow over time.
cells (SCs) to mimic complex tissues while work that provides greater physiological Traditional organoid culture techniques
retaining genomic stability and response relevance allowing for deeper insight into involve light microscopy, High Content
to drug treatments. Conventional, the characterization of patient-specific Screening (HSC) or cytometers. However,
two-dimensional cell cultures have primary tissue and a better understanding these tools are limited in that they lack
been a fundamental tool for finding of the biological pathways of pathological validated protocols for reproducible well-to-
new medicines for decades. However, diseases. Organoids and spheroids, a well organoid formation, are low throughput,
they have limited ability to generate the less-complex but still 3D collection of cells, involve manual, time-consuming image
information needed to develop more provide new opportunities in different acquisition, and require the use of a third
complex 3D advanced cell models, study therapeutic areas and may eliminate the party software for analysis. Due to limited
tumor microenvironment and determine need for longer term of animal studies. quantitative information and loss of
when these cultures become functionally environmental of control during acquisition
matured, used for further downstream Organoids have a distinct advantage of organoid images, a lot of variability can be
assays. As such, organoids, which consist over traditional 2D cultures and hold observed throughout the assay.