


Application Note 5「Fast quantitation of proteins and antibodies using the BLItz system」
ホワイトペーパー
このカタログについて
| ドキュメント名 | Application Note 5「Fast quantitation of proteins and antibodies using the BLItz system」 |
|---|---|
| ドキュメント種別 | ホワイトペーパー |
| ファイルサイズ | 485.2Kb |
| 取り扱い企業 | ザルトリウス・ジャパン株式会社 (この企業の取り扱いカタログ一覧) |
この企業の関連カタログ


このカタログの内容
Page1
APPLICATION NOTE 5
Fast quantitation of proteins and antibodies using
the BLItz system
Renee Tobias, Application Scientist, ForteBio
Introduction similar unknown samples can then be determined using the
Quantitate Sample application module. Standard curves can be
Traditional techniques for determining concentration of a saved and utilized for subsequent quantitation experiments.
target protein such as ELISA and HPLC are both elaborate and
time-consuming, especially when analyzing complex matrices.
For bioprocess development and production applications, the Dip and Read biosensors for protein
use of more rapid protein analysis techniques enables timely, quantitation
informed process decisions. This application note describes Analyte-specific Dip and Read biosensors come pre-immo-
the use of the BLItz® system to both streamline workflows and bilized with capture molecules such as: anti-human IgG Fc,
obtain rapid, direct quantitation of proteins in crude matrices. anti-murine IgG Fv, Protein A, Protein G, Protein L, anti-hu-
man Fab-CH1, anti-GST, Ni-NTA and anti-penta-HIS. These
About the BLItz system ready-to-use biosensors are suitable for quantitative analysis
The BLItz system provides a simple, rapid Dip and Read™ of IgGs or recombinant proteins that have affinity for these
approach for protein quantitation in a small, affordably priced capture molecules. The Streptavidin Biosensor can be load-
personal assay system. With the BLItz system, proteins and ed with biotinylated capture molecules to customize an assay
antibodies can be quantitated in a matter of seconds with high for other target proteins. Binding to the biosensor surface
specificity and sensitivity, even in crude samples. The system is highly specific, enabling differentiation between a target
utilizes the same proprietary Bio-Layer Interferometry (BLI) protein and other media components. Measurements can
technology as ForteBio’s Octet platform, enabling real-time be made quickly and precisely even in unpurified samples,
analysis of interactions on the surface of disposable fiber optic greatly simplifying analyses at all stages of research, process
biosensors. Affinity, concentration and binding kinetics can be development and manufacturing. Rapid, easy and accurate
measured right at the bench in a 4 µL drop of sample. quantitation of proteins can be achieved for bioprocess de-
velopment applications such as hybridoma screening, clone
selection, measurement of antibody titers, expression mon-
Quantitation of proteins itoring during or post-production, or optimization of growth
The easy-to-learn BLItz Pro™ Data Analysis software provides conditions and expression systems.
application modules for analysis of presence, quantity, activity
and specificity of a protein of interest. Based on the specificity Determining antibody titer in hybridoma
of the capture molecule immobilized on the biosensor, a protein samples
of interest can be selectively measured even in complex sam-
ple matrices such as culture media, supernatant or cell lysate. Monoclonal antibodies are essential tools in biomedical
research and are of great commercial value as reagents and
To evaluate protein concentration using the BLItz system, the biotherapeutics. While technology for producing monoclonal
rate of protein binding to the surface of a disposable biosensor antibodies from hybrid cell lines has undergone major advanc-
is measured in real time using a 4 µL drop of sample. The con- es in recent years, the methods available for screening indi-
centration of target protein in the sample is directly proportional vidual hybridoma clones have varied very little over the same
to the binding rate. Using the Create Standard Curve applica- time period. Techniques such as ELISA for screening cell lines
tion module, a standard curve can be generated from samples can be cumbersome, requiring significant amounts of material,
of known concentrations. The concentration of the protein in
1
Page2
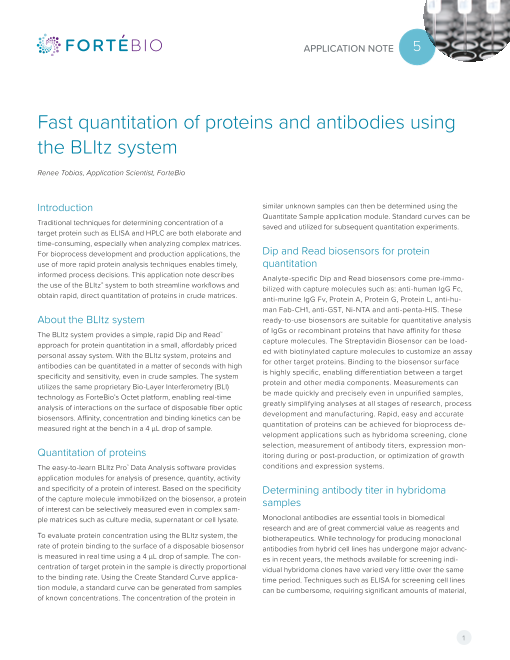
Protein Detection in Complex Samples
BLItz System
Hydrate biosensors
10 min
12–15 minutes total assay time
4 µL sample required
Load biosensor, run
reference and unknown
2–5 min
HPLC
Rinse components,
Wash system Equilibrate column empty waste
10 min 5–10 min 5–10 min
40–120 minutes total assay time
>100 µL sample required
Buer prep Sample injection,
0–30 min detect peaks
20–60 min
ELISA
Wash, incubate Wash, incubate with Develop color,
Bind antigen to plate Wash, block plate with antibody detection antibody read assay
Overnight 60 min 60 min 60 min 5–20 min
3–4 hours + overnight incubation total assay time
100–200 µL sample + target-specific antibodies required
Figure 1: Comparison between protein detection using the BLItz system and alternative techniques.
multiple wash steps and excessive hands-on time (Figure 1). culture medium at known concentrations. The matrix used
Label-free detection with the BLItz system provides a simple, for calibration samples was Iscove’s Modified Dulbecco’s
fast and accurate solution for characterization and monitoring Medium (IMDM) with nutritional supplements and 1% fetal bo-
of hybridoma cultures. Here we present how the BLItz system vine serum. Protein G biosensors (ForteBio part no. 18-5082)
was used to streamline quantitation in the monoclonal antibody were pre-hydrated with the same media. Using the Create
production process for a tissue culture group at a ForteBio Standard Curve module in BLItz Pro Data Analysis software,
customer site. sample data were entered and 4 µL of each concentration
was run for 30 seconds with shaker enabled. A reference bi-
For this customer, a leader in production of antibodies, ELISA
osensor was also run in media with no target antibody in or-
kits, dyes and reagents for the life science industry, it is critical
der to subtract background response caused by non-specific
to produce high-quality reagents in an efficient and timely
binding of media components and serum to the biosensor.
manner. The group faced issues with variable protein titer and
Following data acquisition, the software calculated binding
occasional low protein recovery. Without an efficient method to
rates and automatically generated a standard curve which
determine titer in complex hybridoma supernatants, the amount
can be fitted by linear, linear point-to-point or 5PL equations.
of antibody being produced in culture remained uncertain until
The standard curve was then saved for use in subsequent
harvesting and purification was performed. The group stood
quantitation experiments.
to save a great deal of time and materials by harvesting earlier
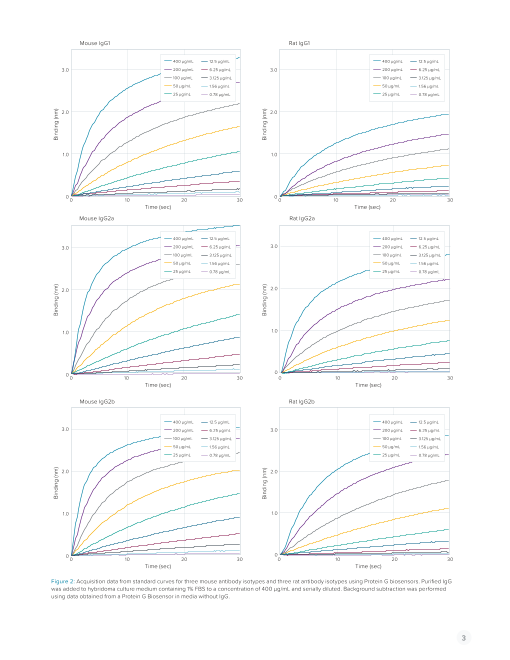
in the production process. Quantitation using the BLItz system Figure 2 shows real-time acquisition data from standard
and Protein G biosensors provided a solution for easy and curves for three mouse antibody isotypes and three rat an-
efficient assessment of antibody titer in complex hybridoma tibody isotypes. Note that even in the presence of complex
supernatants during production. media components and a low serum amount, binding rates
for each concentration can be determined quickly with high
GENERATING A STANDARD CURVE sensitivity down to 1.56 µg/mL for some isotypes. The work-
ing dynamic range of the BLItz system is broad, enabling
Prior to running a quantitation assay on a hybridoma sam- measurement of antibodies from below 1 µg/mL up to 4 mg/
ple, isotype-matched standard curves were generated. For mL (actual dynamic range depends on analyte and biosensor
each standard curve, a purified monoclonal antibody of the choice). In contrast, ELISA tends to have a narrower dynamic
same isotype as the unknowns was spiked into hybridoma range and often requires dilution of samples.
2
Page3
Mouse IgG1 Rat IgG1
400 µg/mL 12.5 µg/mL 400 µg/mL 12.5 µg/mL
3.0 200 µg/mL 6.25 µg/mL 3.0 200 µg/mL 6.25 µg/mL
100 µg/mL 3.125 µg/mL 100 µg/mL 3.125 µg/mL
50 µg/mL 1.56 µg/mL 50 µg/mL 1.56 µg/mL
25 µg/mL 0.78 µg/mL 25 µg/mL 0.78 µg/mL
2.0 2.0
1.0 1.0
0 0 10 20 30 0 0 10 20 30
Time (sec) Time (sec)
Mouse IgG2a Rat IgG2a
400 µg/mL 12.5 µg/mL 400 µg/mL 12.5 µg/mL
3.0 200 µg/mL 6.25 µg/mL 3.0 200 µg/mL 6.25 µg/mL
100 µg/mL 3.125 µg/mL 100 µg/mL 3.125 µg/mL
50 µg/mL 1.56 µg/mL 50 µg/mL 1.56 µg/mL
25 µg/mL 0.78 µg/mL 25 µg/mL 0.78 µg/mL
2.0 2.0
1.0 1.0
0 0
0 10 20 30 0 10 20 30
Time (sec) Time (sec)
Mouse IgG2b Rat IgG2b
400 µg/mL 12.5 µg/mL 400 µg/mL 12.5 µg/mL
3.0 200 µg/mL 6.25 µg/mL 3.0 200 µg/mL 6.25 µg/mL
100 µg/mL 3.125 µg/mL 100 µg/mL 3.125 µg/mL
50 µg/mL 1.56 µg/mL 50 µg/mL 1.56 µg/mL
25 µg/mL 0.78 µg/mL 25 µg/mL 0.78 µg/mL
2.0 2.0
1.0 1.0
0 0
0 10 20 30 0 10 20 30
Time (sec) Time (sec)
Figure 2: Acquisition data from standard curves for three mouse antibody isotypes and three rat antibody isotypes using Protein G biosensors. Purified IgG
was added to hybridoma culture medium containing 1% FBS to a concentration of 400 µg/mL and serially diluted. Background subtraction was performed
using data obtained from a Protein G Biosensor in media without IgG.
3
Binding (nm) Binding (nm) Binding (nm)
Binding (nm) Binding (nm) Binding (nm)
Page4
Clone 1 — Mouse IgG1 13.5 µg/mL
rds
2.0 Reference Standa
Sample 0.20 Unknowns
Fitted curve
1.0 0.10
0
0
0 5 10 15 20 25 30 0 0.02 0.04 0.06 0.08 0.10 0.12
Time (sec) Concentration (mg/mL)
Clone 2 — Mouse IgG2a 38.0 µg/mL
Reference Standards
2.0 Sample 0.30 Unknowns
Fitted curve
0.20
1.0
0.10
0 0
0 5 10 15 20 25 30 0 0.02 0.04 0.06 0.08 0.10 0.12
Time (sec) Concentration (mg/mL)
Clone 3 — Mouse IgG2b 61.3 µg/mL
1.6
Reference Standards
2.0
Sample 1.2 Unknowns
Fitted curve
0.8
1.0
0.4
0
0 5 10 15 20 25 30 0
0 0.10 0.20 0.30 0.40 0.50
Time (sec) Concentration (mg/mL)
Clone 4 — Rat IgG1 230 µg/mL
Reference 0.30 Standards
2.0 Sample Unknowns
Fitted curve
0.20
1.0
0.10
0
0
0 5 10 15 20 25 30 0 0.10 0.20 0.30 0.40 0.50
Time (sec) Concentration (mg/mL)
Clone 5 — Rat IgG2a 12.8 µg/mL
Reference Standards
2.0 0.16
Sample Unknowns
Fitted curve
1.0 0.08
0 0
0 5 10 15 20 25 30 0 0.02 0.04 0.06 0.08 0.10 0.12
Time (sec) Concentration (mg/mL)
Clone 6 — Rat IgG2b 16.0 µg/mL
Standards
2.0 Reference 0.12
Sample Unknowns
Fitted curve
0.08
1.0
0.04
0 0
0 5 10 15 20 25 30 0 0.02 0.04 0.06 0.08 0.10 0.12
Time (sec) Concentration (mg/mL)
Figure 3: Quantitation of six hybridoma supernatant samples. Acquisition data is shown on the left, along with the reference biosensor data used for back-
ground subtraction for each sample. Isotype-matched standard curves from the acquisition data in Figure 2 are shown on the right, with sample binding rates
fitted and calculated concentrations listed.
4
Binding (nm) Binding (nm) Binding (nm) Binding (nm) Binding (nm) Binding (nm)
Binding Rate (nm/s) Binding Rate (nm/s) Binding Rate (nm/s) Binding Rate (nm/s) Binding Rate (nm/s) Binding Rate (nm/s)
Page5
QUANTITATING UNKNOWN SAMPLES generated for each biosensor type using the Create Standard
To determine antibody concentration in the unknown samples, Curve module in BLItz Pro Data Analysis software. A 4 µL drop
supernatant was harvested and a 4 µL drop of sample was of culture supernatant from flasks 1 and 2 at Days 5 and 6 was
pipetted into the BLItz system. Sample information was entered analyzed on each biosensor for 30 seconds using the Quanti-
in the Quantitate Sample module in BLItz Pro Data Analysis tate Sample module as described above. A reference biosensor
software. A pre-hydrated Protein G Biosensor was loaded in run in media alone was used in each experiment to subtract
the instrument. The assay was run for 30 seconds with shaking background response. Samples were analyzed in duplicate with
enabled, as with the standard samples. A reference sample one replicate neat and the other at a 2-fold dilution in culture
consisting of media alone was also run. After data acquisition, media, with back-calculated original concentrations averaged
unknowns were automatically fit to the standard curve and con- to yield final concentration value. Note that in this experiment
centrations calculated. the exact protein to be quantitated was also used to generate
the standard curve. Measuring sample concentration against a
Figure 3 shows data acquired from six hybridoma samples, standard curve made with the same protein will give the most
along with standard curves calculated from the data in Fig- accurate results. When quantitating antibodies, if the identical
ure 2. Each sample was matched to the standard curve with antibody is not available, it is recommended to use one of the
the same species/isotype for highest accuracy. All samples fell same isotype as the one being analyzed. It is also important to
within the range covered by their respective standard curves, dilute the standards in the same buffer or media as the samples.
which is important for accurate quantitation. Calculated sample
concentrations in this experiment ranged from 12.8 µg/mL to Table 1 and Figure 4 present a direct comparison of data for
230 µg/mL. The concentration data determined by this method Antibody A1 transient transfection between the BLItz system
has enabled this group to make predictions on yield from large and HPLC. Calculated titer in µg/mL is shown for each flask
scale monoclonal antibody production, and better estimate ap- versus collection day. Samples run using Protein A biosensors
propriate times for harvesting. Use of the BLItz system can also were matched to the calibration curve for Protein A, and Protein
be applied to optimization of culture conditions, screening and G samples matched to the Protein G curve. The results show
selection of the highest producing clones for production or cell that titers calculated from BLItz system data using both Protein
banking, or determining the effect of supplements and growth A and Protein G biosensors are very similar, and also similar to
factors on titer. the titer calculated from the HPLC analysis. The percent CVs
between the three methods are 12% or lower for each flask and
time point. The chart in Figure 4 clearly illustrates the con-
Comparison of BLitz and HPLC quantitation sistency in data produced with the BLItz system using differ-
data ent biosensor types in separate experiments, as well as the
Recombinant antibody production is the major focus in many consistency in data between the BLItz system and HPLC. While
drug discovery research and bioprocessing applications, and the results obtained from the two platforms are similar, HPLC
accurate concentration data is essential to evaluating the pro- systems require considerably more processing time, sample
ductivity of antibody producing clones. A number of techniques volume, instrument handling and maintenance. With the BLItz
are available for the purpose of quantitating antibodies in cell system, accurate, real-time binding data can be acquired in a
culture supernatants, including ELISA, HPLC, or spectroscopy. matter of seconds with minimal processing, providing a fast and
In this section we show platform comparison data, courtesy of convenient alternative for protein quantitation.
another ForteBio customer, which clearly demonstrate the ac-
curacy of the BLItz system when compared directly with HPLC. Specific detection of Fab fragments in the
A recombinant antibody of interest, Antibody A1, was transiently presence of free light chains
transfected into 293F cells (Invitrogen) and grown in serum-free In the production of recombinant IgG and Fab fragments,
media in two flasks over an 8-day expression cycle. To assess over-expression of light chains can often be problematic. A
titer, suspension media was collected daily and monitored majority of currently available methods for detection and quan-
for yield. To quantify, 100 µL of supernatant was loaded onto titation of human Fab fragments utilize binding agents such as
a POROS® 20 micron Protein G column (0.1 mL, Applied Bio- Protein L, which targets epitopes that reside on the antibody
systems) and run on a Waters® e2695 HPLC system. At Days light chain. Using these methods, accurate determination of
5 and 6, the BLItz system was utilized in parallel with HPLC. Fab concentration can be difficult due to ligand cross-binding
Protein A (ForteBio part no. 18-5010) or Protein G biosensors to contaminating free light chains (Figure 5). Here we describe
(ForteBio part no. 18-5082) were pre-hydrated in culture media a method for selective analysis of intact Fab fragments and
prior to use. Purified Antibody A1 protein was spiked into the IgG using an affinity ligand that targets the CH1 domain on the
same media at known concentrations and a standard curve was heavy chain of the Fab fragment.
5
Page6
Flask 1 Flask 2
Day Pro A - BLItz Pro G - BLItz Pro G - HPLC Pro A - BLItz Pro G - BLItz Pro G - HPLC
5 27.81 27.92 28.44 30.37 33 n/a 22.97 23.84 18.69 26.34 25 n/a
6 31.46 32.94 31.66 34.76 36 36 27.28 26.04 25.36 28.83 29 n/a
Table 1: Summary of quantitation data obtained on the BLItz system and HPLC for Antibody A1 transient transfection supernatants. Calculated titer in µg/mL for replicate
runs is listed for each flask versus collection day.
40
Flask 1 Flask 2
35
30
25 BLItz (Protein A)
BLItz (Protein G)
HPLC (Protein G)
20
15
10
5
0
5 6 5 6
Day
Figure 4: BLItz system versus HPLC comparison for Antibody A1 transient transfection supernatants. Titers calculated from BLItz
system data using both Protein A and Protein G biosensors are very similar to each other and to the titer calculated from HPLC
data, demonstrating the consistency between platforms.
ForteBio’s Anti-Human Fab-CH1 biosensors allow highly spe- unknowns were run on both biosensor types using the Create
cific binding to the CH1 region of human Fab, F(ab’)2 and IgG. Standard Curve and Quantitate Sample modules in BLItz Pro
Anti-Human Fab-CH1 biosensors exhibit no cross-binding to Data Analysis software, respectively. A 4 µL drop was used for
antibody light chains, and when used in conjunction with the each sample and data acquired for 30 seconds.
BLItz system offer a fast, simple method for selective quantita-
tion of Fab/F(ab’)2 fragments in the presence of contaminating Data obtained on the Fab samples containing free kappa
free light chain species. light chain for both biosensors are presented in Figure 6.
The binding curves for Fab fragments analyzed on Anti-Hu-
To demonstrate the high level of specificity of Anti-Human Fab- man Fab-CH1 biosensors were unaffected by the presence
CH1 biosensors, the effect of free light chains on the analysis of free light chains, while Protein L biosensors show in-
of a human Fab fragment was investigated. Samples were creasing signal with higher concentrations of light chains.
prepared in conditioned CHO cell culture media (Aragen Bio- Since the concentration of Fab in the sample is constant,
sciences) containing approximately 17 µg/mL of a Fab fragment this increase is suggestive of co-binding of free light chains
derived from whole human IgG (Jackson Immunoresearch) and by Protein L. A chart comparing calculated concentration of
spiked with free human kappa light chain from Bence Jones Fab between the two biosensors is shown in Figure 7. These
protein (Meridian Life Science) at final concentrations of data clearly demonstrate that increased binding to Protein L
0 µg/mL, 10 µg/mL or 50 µg/mL. The Fab fragment was also biosensors corresponds to higher concentration of free light
serially diluted in the same conditioned CHO cell culture media chains, whereas binding to Anti-Human Fab-CH1 biosensors
to generate a standard curve (data not shown). Conditioned remains constant. This high specificity of Fab binding makes
media was also used to pre-wet Anti-Human Fab-CH1 bio- the Anti-human Fab-CH1 Biosensor extremely useful for
sensors (ForteBio part no. 18-5104) and Protein L biosensors pre-purification analysis of Fab samples.
(ForteBio part no. 18-5085) for 10 minutes. Standard curves and
6
Titer (µg/mL)
Page7
Anti-Human Tips for quantitation assays
Fab-CH1 Protein L
Intact Fab fragments • Pre-hydrate biosensors for at least 10 minutes in buffer ma-
trix that exactly matches the sample to be analyzed. This will
Free kappa light chains
- monomer LC minimize background response from non-specific binding to
- dimer LC2 the biosensor.
• When generating standard curves or running unknowns,
always run a reference sample that matches the matrix of the
sample(s) to be analyzed but does not contain the protein of
interest. This will allow for subtraction of any response gener-
Figure 5: Selectivity of Anti-Human Fab-CH1 versus Protein L biosensors for ated by non-specific binding to the biosensor.
intact Fab fragments.
• For accurate results, a standard curve must be generated
using the same protein as the sample(s) to be quantitated.
A range of biosensors are available for use on the BLItz • The standards should be diluted in a buffer matrix that exactly
system with high levels of specificity for analysis in complex matches that of the unknown sample(s).
matrices. For example, Anti-Mouse IgG Fc (ForteBio part no.
18-5088) and Anti-Human IgG Fc (ForteBio part no. 18-5060) • Standard curves can be saved and utilized for subsequent
biosensors offer selective capture of mouse or human IgGs, experiments, as long as the biosensors are from the same
respectively. Streptavidin biosensors can be loaded with a manufacturing lot as those used to run the samples.
biotinylated capture molecule of choice to create custom • The concentration of sample(s) being analyzed should fall
biosensors that enable an unlimited range of assays. within the concentration range of the standard curve for
accurate quantitation.
Protein L — Free light chain cross-reacts with Protein L biosensor Anti-hu Fab-CH1 — Free light chain does not influence signal
from Fab binding to Anti-Fab biosensor
3.0 0.5
2.5 0 µg/mL 0.4 0 µg/mL
10 µg/mL 10 µg/mL
2.0 50 µg/mL 50 µg/mL
0.3
1.5
0.2
1.0
0.1
0.5
0 0
0 5 10 15 20 25 30 0 5 10 15 20 25 30
Time (sec) Time (sec)
Figure 6: Effect of free kappa light chains on quantitation of human Fab fragment samples using Protein L biosensors (left) compared to Anti-Human Fab-CH1 bio-
sensors (right). Varying levels of human kappa light chain were spiked into samples containing 17 ug/mL human Fab fragment and analyzed on both biosensor types.
Real-time binding data is shown. Increased response on Protein L biosensors indicates cross reactivity to free light chains.
7
Binding (nm)
Binding (nm)
Page8
250
Protein L
Anti-hu Fab-CH1
200
150
Free light chain
(µg/mL) Anti-Hu Fab-CH1 Protein L
100
0 µg/mL 16.17 15.52
10 µg/mL 16.88 50.57
50
50 µg/mL 16.02 214.6
0 Table 2: Calculated Fab concentrations
0 10 50
µg/mL Free Light Chain
Figure 7: Increasing binding rates and calculated concentrations with Protein L biosensors corresponds directly with increasing concentration of free light chains in the
Fab samples, even though concentration of Fab remained constant. Anti-Human Fab-CH1 biosensors display high specificity for intact Fab molecules.
Conclusion BLItz system ordering and contact
We have presented methods and data demonstrating quantita- information
tion of proteins on the BLItz system and how this capability can • To request a quote, visit www.fortebio.com/blitz.html and click
be utilized to improve workflows when paired with a wide selec- Get Quote
tion of pre-immobilized biosensors. The ability to quantitatively • For a list of available biosensor types, visit
measure target proteins directly in complex matrices using 4 µL www.fortebio.com/biosensor-types.html
of sample allows rapid, simple, powerful analyses on the BLItz
system that are not possible with other platforms. • For technical support, go to www.fortebio.com/support.
References
1 BLItz Quick Start Guide: Provided with all BLItz systems. Current version can
be downloaded from www.blitzmenow.com/literature.html.
2 BLItz Demo and Starter Guide: Provides detailed step-by-step guidance on
setting up assays using the BLItz starter kit.
3 ForteBio Technical Note 28: Biotinylation of protein for immobilization onto
Streptavidin biosensors. www.fortebio.com/literature.html.
4 ForteBio Application Note 9: CaptureSelect Affinity Ligands for Antibody
Detection and Characterization. www.fortebio.com/literature.html.
ForteBio ForteBio Analytics (Shanghai) Co., Ltd. Molecular Devices (UK) Ltd. Molecular Devices (Germany) GmbH
47661 Fremont Boulevard No. 88 Shang Ke Road 660-665 Eskdale Bismarckring 39
Fremont, CA 94538 Zhangjiang Hi-tech Park Winnersh Triangle 88400 Biberach an der Riss
888.OCTET-75 or 650.322.1360 Shanghai, China 201210 Wokingham, Berkshire Germany
www.fortebio.com fortebio.info@moldev.com salesops.china@moldev.com RG41 5TS, United Kingdom + 00800 665 32860
+44 118 944 8000
uk@moldev.com
©2019 Molecular Devices, LLC. All trademarks used herein are the property of Molecular Devices, LLC. Specifications subject to change without
notice. Patents: www.moleculardevices.com/product patents. FOR RESEARCH USE ONLY. NOT FOR USE IN DIAGNOSTIC PROCEDURES.
AN-4005 Rev D
Calculated Fab Concentration (µg/mL)