


A rapid method to quantitatively screen bispecific antibody using Protein A and His1K biosensors
ホワイトペーパー
このカタログについて
| ドキュメント名 | A rapid method to quantitatively screen bispecific antibody using Protein A and His1K biosensors |
|---|---|
| ドキュメント種別 | ホワイトペーパー |
| ファイルサイズ | 780.7Kb |
| 取り扱い企業 | ザルトリウス・ジャパン株式会社 (この企業の取り扱いカタログ一覧) |
この企業の関連カタログ


このカタログの内容
Page1
APPLICATION NOTE 29
A rapid method to quantitatively screen bispecific
antibody using Protein A and His1K biosensors
Eva Rubio-Marrero, Danyang Huang and Girish Pendse, Celgene Corporation, Summit, NJ
Hongshan Li and Sriram Kumaraswamy, ForteBio, Fremont, CA
Introduction assay using the Octet® HTX system to identify pools and clones
with higher concentrations of bispecific antibodies.
Bispecific antibodies (bsAbs) were first reported by Nisonoff
and Rivers in 19611, however the engineering challenges The ease of use and rapid processing of samples makes the
associated with bsAbs have limited their development. Recent Octet HTX system an excellent option for higher throughput
advances in biotechnology have fueled development in the applications such as expression clone screening and bispecific
last 10 years. To date, two bispecific antibody drugs (blinatum- molecule evaluation. For example, bsAb binding optimization
omab and emicizumab) are on the market, and over 85 are in only takes 10 min (Figure 3). By combining the power of Dip and
clinical development. Because this wide array of bsAbs is pop- Read™ biosensors with the Octet HTX system, one can minimize
ulated by many different species, comprising many different time, effort, and costs in the assay development of bispecific
formats (including various engineering of antibody fragments therapeutics.
in a symmetric or asymmetric manner), functional evaluation of Here we demonstrate the simple design for a bsAb quantita-
bsAbs during bioprocessing is critical and challenging. ELISA tive assay on the Octet system (Figure 1). The high-throughput
and SPR are currently the most commonly used methods for Octet platform allows for rapid screening of cell lines express-
bsAbs evaluation, they are both, however, time consuming. ing the target bsAb. This assay consists of capturing bsAb
Therefore, there is high demand for a simple method for the by each antigen-binding site region sequentially using the
functional assessment of two or more interactions of the com- correspondent antigen loaded onto the biosensor surface.
plex bispecific therapeutics2. For each molecule antigen, a reference material is required to
The production of bsAbs adds a challenge for scientists in the develop the assay, as well as positive and negative controls.
cell line screening process since many other conformations of The developed BLI method offers an easy screening method
antibodies can be produced by the cells. If screening is based and workflow that assesses bsAb interactions in a versatile,
only on Protein A titer, good pools and clone candidates might label-free, and easy-to-use format.
be discarded. For this reason, we developed a high-throughput
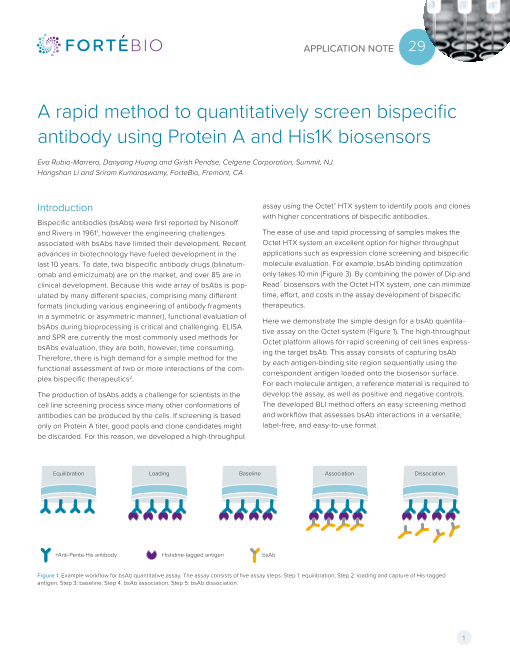
Equilibration Loading Baseline Association Dissociation
+Anti-Penta-His antibody Histidine-tagged antigen bsAb
Figure 1: Example workflow for bsAb quantitative assay. The assay consists of five assay steps. Step 1: equilibration, Step 2: loading and capture of His-tagged
antigen, Step 3: baseline, Step 4. bsAb association, Step 5: bsAb dissociation.
1
Page2
Materials and reagents • Standard curve generation (Technical Note 15 for details3)
• Octet instrument with Octet Data Acquisition and Data Analy- • Comparison of results with reference standard (antibody con-
sis software centrations measured by ProA biosensors)
• HIS1K biosensor, ForteBio part No. 18-5120
• Protein A (ProA) biosensor, ForteBio part No. 18-5010 Biosensor selection
• 96-well black plate, flat bottom, polypropylene microplate, ForteBio biosensors are coated with a proprietary biocom-
Greiner Bio-One, ForteBio part No. 655209 patible matrix that is uniform and non-denaturing with minimal
non-specific binding. The tips are derivatized and ready for
• 384-well, black, flat bottom, polypropylene microplate. use in a diverse set of biomolecular applications. The choice of
Greiner Bio-One, ForteBio part No. 781209 biosensors depends on the assay format. For example, in these
• Buffer for sample dilution and biosensor hydration studies, HIS1K biosensors were selected for antigen immobili-
• His-tagged antigens specific for each arm of the bsAb zation due to the availability of His-tagged antigens. Protein A
• bsAb reference material (positive control) biosensors were used for antibody quantitation. An advantage
of these biosensors is that they come ready to be used and can
• Regeneration buffer 10 mM Glycine pH 1.5 be regenerated.
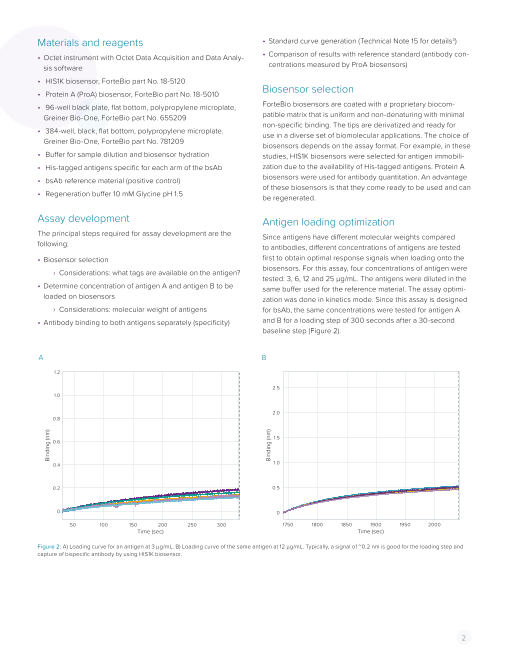
Assay development Antigen loading optimization
The principal steps required for assay development are the Since antigens have different molecular weights compared
following: to antibodies, different concentrations of antigens are tested
• Biosensor selection first to obtain optimal response signals when loading onto the
› Considerations: what tags are available on the antigen? biosensors. For this assay, four concentrations of antigen were
tested: 3, 6, 12 and 25 µg/mL. The antigens were diluted in the
• Determine concentration of antigen A and antigen B to be same buffer used for the reference material. The assay optimi-
loaded on biosensors zation was done in kinetics mode. Since this assay is designed
› Considerations: molecular weight of antigens for bsAb, the same concentrations were tested for antigen A
• Antibody binding to both antigens separately (specificity) and B for a loading step of 300 seconds after a 30-second
baseline step (Figure 2).
A B
1.2
2.5
1.0
2.0
0.8
1.5
0.6
0.4 1.0
0.2 0.5
0 0
50 100 150 200 250 300 1750 1800 1850 1900 1950 2000
Time (sec) Time (sec)
Figure 2: A) Loading curve for an antigen at 3 µg/mL. B) Loading curve of the same antigen at 12 µg/mL. Typically, a signal of ~0.2 nm is good for the loading step and
capture of bispecific antibody by using HIS1K biosensor.
2
Binding (nm)
Binding (nm)
Page3
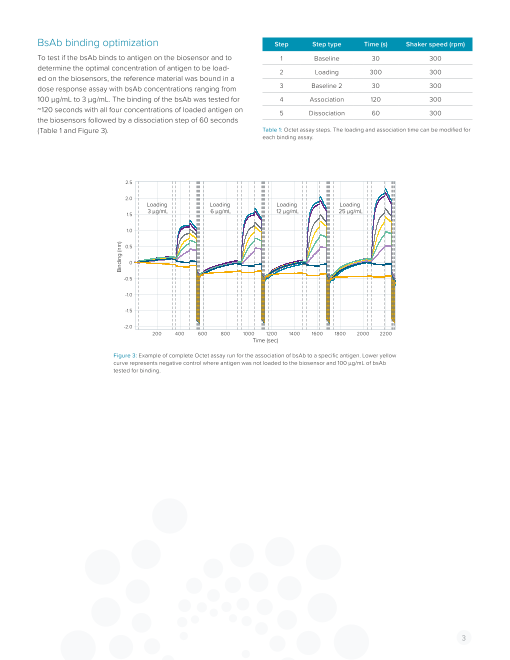
BsAb binding optimization Step Step type Time (s) Shaker speed (rpm)
To test if the bsAb binds to antigen on the biosensor and to 1 Baseline 30 300
determine the optimal concentration of antigen to be load- 2 Loading 300 300
ed on the biosensors, the reference material was bound in a
dose response assay with bsAb concentrations ranging from 3 Baseline 2 30 300
100 µg/mL to 3 µg/mL. The binding of the bsAb was tested for 4 Association 120 300
~120 seconds with all four concentrations of loaded antigen on 5 Dissociation 60 300
the biosensors followed by a dissociation step of 60 seconds
(Table 1 and Figure 3). Table 1: Octet assay steps. The loading and association time can be modified for
each binding assay.
2.5
2.0
Loading Loading Loading Loading
1.5 3 µg/mL 6 µg/mL 12 µg/mL 25 µg/mL
1.0
0.5
0
-0.5
-1.0
-1.5
-2.0
200 400 600 800 1000 1200 1400 1600 1800 2000 2200
Time (sec)
Figure 3: Example of complete Octet assay run for the association of bsAb to a specific antigen. Lower yellow
curve represents negative control where antigen was not loaded to the biosensor and 100 µg/mL of bsAb
tested for binding.
3
Binding (nm)
Page4
The results were analyzed using the Octet Data Analysis Standard curve generation
software. The optimal loading concentration of antigen was
selected based on good separation of curves between the Once the antigen loading concentration, loading time, and
different concentrations of bsAb. The binding response signals association time are known, a standard curve can be generat-
(step 4 in Figure 3) can be exported and plotted as a function ed for each antigen using the resultant dose response curves.
of bsAb concentration. Linearity in the resultant curve can be Typically, samples are run in triplicate for the standard curve
used to identify the optimal antigen loading concentration. The generation. A variation of less than 10% CV should be expected
minimum concentration that results into the widest dynamic (Figure 5). Additional to the binding assay, a standard curve can
linear range should be selected. In addition, the best response be generated using the ProA biosensors to calculate the total
without binding saturation at the highest concentration of bsAb protein concentration in the sample. This concentration of total
should be targeted. A negative control to verify the absence of protein can be used in combination with binding results to rank
non-specific binding from the bsAb should also be performed the best pools and clones expressing bsAb.
using biosensors that are not loaded with antigen (Figure 4).
Typically, a signal shift of 0.2 nm is a good starting point for the
loading step and capture of the bispecific antibody.
A 2.5 B 2.5
2.0 2.0
1.5 1.5
1.0 1.0
0.5 0.5
0 0
360 380 400 420 440 460 480 2080 2100 2120 2140 2160 2180
Time (sec) Time (sec)
Figure 4: A) The bsAb binding curves at different concentrations to 3 µg/mL of antigen. B) The bsAb binding curves to 12 µg/mL of antigen. The 12 µg/mL concentration
of antigen was chosen for the loading step.
A B
1 2 3 4 5 6 7 8 9 10 11 12 13 14 15 16 17 18 19 20 21 22 23 24 0.7
A L B L B L B
B 0.6
C L B L B L B
D
E L B L B L B 0.5
F
G L B L B L B
H 0.4
I L B L B L B
J 0.3
K L B L B L B
L
M L B L B L B 0.2 Standard
N Fitting Curve
O L B L B L B 0.1 Unknown & Control
P
0
0 20 40 60 80 100 120
Concentration (µg/ml)
Figure 5: A) Plate layout to generate standard curve following the steps shown in Table 1 using triplicate of reference material at different concentrations (purple wells).
B represents buffer well and L represents loading well. B) Standard curve prepared using triplicate samples of reference material from 3–100 µg/mL (purple dots). Gold
dots represent unknown samples tested in the assay showing different concentrations based on the standard curve generated.
4
Binding (nm)
Binding Rate Binding (nm)
Page5
Analysis and results using reference material is mostly pure bsAb, the calculated ratio is close to 1 but this
may vary from molecule to molecule (Table 2). For pool or clone
To verify that the binding assay is consistent, the reference ma- screening purposes, this reference material should be used
terial was tested at different concentrations in duplicate using in every assay and top pools/clones should be chosen with
the assay parameters tested before. As previously described, a similar ratio to the reference material. A ratio of 1 to 1.3 over
the antigen was loaded after a baseline step, and after a sec- five different dilutions were obtained and the assay variation of
ond baseline, the bsAb was associated to the antigen followed <30% was used for the ranking assay.
by a dissociation step (see Table 1). This assay was performed
with binding assays where each antigen is loaded to the HIS1K Since the overall titer is important when choosing the top pools/
biosensors. Antigen binding assay specification can be verified clones, the concentrations of the samples can be obtained by
using half molecule controls if these reagents are available performing a ProA titer assay with ProA biosensors and corre-
(data not shown). Buffer was used as a negative control. sponding standard curve. Table 3 shows an example of results
from a mini pool screening in a 96-well plate. The Octet bsAb
To analyze the results, the Octet Data Analysis Software was binding assay as well as ProA titer was performed using the
used and the Association step was selected3. To obtain the pooled supernatant after incubation of seven days at 36.5°C.
concentrations of the samples, the curves were analyzed using As shown in the table, if the top six pools were chosen based
the standard curve generated previously for each antigen. The on total ProA titer, most of the pools were expressing low levels
concentrations obtained should be close to the known concen- of bsAb. Taking in to consideration the binding ratio for the an-
tration of the samples (could have small variation) and similar tigens and the overall ProA titer could help in selecting the top
between duplicates. Having the concentration from both bind- pools with higher bsAb expression levels at earlier stages of the
ing assays, a ratio can be calculated. Since the samples used cell line development process.
here are reference material from the molecule of interest and
Pro A Antigen 1 Antigen 2
Ratio antigen 1/ Ratio antigen 1/
Sample ID Rep. #1 Rep. #2 Rep. #1 Rep. #2 Rep. #1 Rep. #2 antigen 2 – Rep. #1 antigen 2 – Rep. #2
RS 80 µg/mL 75.2 73.2 89.4 86.2 83.2 82 1.1 1.1
RS 40 µg/mL 36.3 35.9 39.8 39.3 39 38.6 1.0 1.0
RS 20 µg/mL 18.7 18 21 21.8 19.3 19.5 1.1 1.1
RS 10 µg/mL 9.48 9.4 10.1 10.5 8.47 8.74 1.2 1.2
RS 5 µg/mL Too low Too low 4.87 5.51 4.17 4.09 1.2 1.3
RS 0 µg/mL 0 0 0 0 0 0 N/A N/A
Table 2: Results of binding assay using bsAb reference material and His-tag antigens corresponding to both antigen-binding site region. Consistency is
shown in replicates demonstrating the accuracy of the standard curve.
5
Page6
Antigen 1 Antigen 2 Ratio Discussion
Mini pool ProA titer binding ( binding antigen 1/
ID (µg/mL) µg/mL) (µg/mL) antigen2 There is currently a limitation in technologies that allow for
quantitative functional assessment of two interactions to one
1 116.5 59.8 68.4 0.9 bispecific molecule in the market. Here we have shown an
2 91.9 54.6 18.3 3.0 easy method for bsAb evaluation. Utilizing Protein A and HIS1K
3 88 38.5 84.3 0.5 biosensors, we were able to identify conditions quickly that are
suitable for quantitative measurement of bispecific binding.
4 85.1 18.6 58.5 0.3
5 80.4 50.8 16.8 3.0 By analyzing specific binding results in addition to IgG titer in
a single high-throughput instrument, we are able to assess the
6 57.7 22.3 27.2 0.8 binding activity of a bispecific molecule to both targets to rank
7 56.5 39 2.04 19.12 the top pools/clones during cell line development. The results
8 56.3 2.9 48.4 0.06 obtained from the Octet binding assay shown here have been
validated using other analytical methods such as RP-HPLC,
9 51.7 23.4 29.7 0.8 CE-SDS, SPR, and LC-MS to show that binding results can be
10 51.5 36.1 3.05 11.8 correlated to the purity of the bsAb from the samples tested.
11 45.9 20.8 27.9 0.75
12 45.7 21.2 28.8 0.7 References
13 45.6 11.6 22 0.53 1 Recombination of a mixture of univalent antibody fragments of different
specificity, Nisonoff A, Rivers MM, Arch Biochem Biophys, 1961;
14 39.8 2.68 4.89 0.5 May;93:460-2.
2 Bispecific antibodies: a mechanistic review of the pipeline, Labrijn AF,
15 36.9 17.8 23 0.8 Janmaat ML, Reichert JM and Parren PWHI, Nature Reviews Drug Discovery,
Reference 2019 Aug;18(8):55-608.
material 53.5 24.4 32 0.8 3 Technical Note 15, High Sensitivity Detection of Human IgG Using Protein A
Biosensors.
Table 3: Results from a mini pool screening in 96-well plate. Mini pools
highlighted were not taken into consideration for further expansion due to the
poor binding to either antigen, suggesting low levels of bsAb expression. Mini
pools without highlighting represent the best pools with high titer and good
binding to both antigens.
ForteBio ForteBio Analytics (Shanghai) Co., Ltd. Molecular Devices (UK) Ltd. Molecular Devices (Germany) GmbH
47661 Fremont Boulevard No. 88 Shang Ke Road 660-665 Eskdale Sauerbruchstr. 50
Fremont, CA 94538 Zhangjiang Hi-tech Park Winnersh Triangle 81377 München
888.OCTET-75 or 650.322.1360 Shanghai, China 201210 Wokingham, Berkshire Germany
www.fortebio.com fortebio.info@moldev.com fortebiosh@moldev.com RG41 5TS, United Kingdom + 00800 665 32860
+44 118 944 8000
uk@moldev.com
©2019 Molecular Devices, LLC. All trademarks used herein are the property of Molecular Devices, LLC. Specifications subject to change without
notice. Patents: www.moleculardevices.com/product patents. FOR RESEARCH USE ONLY. NOT FOR USE IN DIAGNOSTIC PROCEDURES.
FB_4014 Rev A