


Application Note 4「Instant determination of protein presence using the BLItz system」
ホワイトペーパー
このカタログについて
| ドキュメント名 | Application Note 4「Instant determination of protein presence using the BLItz system」 |
|---|---|
| ドキュメント種別 | ホワイトペーパー |
| ファイルサイズ | 816.8Kb |
| 取り扱い企業 | ザルトリウス・ジャパン株式会社 (この企業の取り扱いカタログ一覧) |
この企業の関連カタログ


このカタログの内容
Page1
APPLICATION NOTE 4
Instant determination of protein presence using the
BLItz system
Dan King, Investigator, Novartis Institutes for Biomedical Research Inc.
Weilei Ma, Sr. Scientist, Danfeng Yao, Sr. Scientist and Renee Tobias, Application Scientist, ForteBio
Introduction manufacturing. More importantly, the ability to make these
determinations in crude samples without the need for prior
Often, precious time is lost during protein expression and purification steps can streamline workflows, saving valuable
bioreactor monitoring when simply checking for the presence or time and resources.
absence of the target protein. Common techniques like Western
blot and HPLC require multiple reagents and require significant Rapid, simple and direct methods for small scale qualitative
amounts of time to analyze crude samples. This application evaluation of constructs, expression levels and protein activity
note describes the use of the BLItz® system for instant, specific can be performed using the Quick Yes/No module and dispos-
protein detection in crude matrices, enabling access to re- able Dip and Read biosensors. These methods complement or
al-time sample information during bioprocess development and replace more elaborate and time-consuming techniques such
production. as ELISA, SDS-PAGE and Western blot (Figure 1).
About the BLItz system Relative expression ranking
The BLItz system provides a simple, rapid Dip and Read™ In all stages of biopharmaceutical discovery and development,
approach to protein analysis in an affordably priced personal as- there is a need for rapid qualitative analysis of samples. For ex-
say system. Protein and antibody detection can be performed in ample, identifying optimal secreting candidates from transfect-
a matter of seconds with high specificity and sensitivity, even in ed CHO cells or selecting from numerous hybridoma cell clones
crude samples. The BLItz system utilizes the same proprietary for monoclonal antibody production can be challenging and
Bio-Layer Interferometry (BLI) technology as ForteBio’s Octet labor intensive. Easy assessment of different growth conditions,
platform, enabling real-time, label-free analysis of interactions expression systems and purification methods in bioprocess
on the surface of disposable fiber optic biosensors. Affinity, development can facilitate optimization for bioproduction. Sim-
concentration and binding kinetics can be measured right at the ilarly, manufacturing procedures require constant monitoring of
bench in a 4 µL drop of sample. expression levels in bioreactors.
The Quick Yes/No module on the BLItz system provides a spe-
Quick check for protein presence cific, fast and simple method for comparison of protein levels
The easy-to-learn BLItz Pro™ Data Analysis software provides between samples. Relative amounts of antibody or target pro-
application modules for analysis of presence, quantity, activity tein present in samples can be assessed in a matter of minutes
and specificity of a protein of interest. Here we demonstrate based on binding to a pre-immobilized ligand on a biosensor,
examples of how the Quick Yes/No application module on the allowing for easy ranking of clones or conditions.
BLItz system can be successfully utilized in a variety of assay Here we use Anti-GST biosensors for real-time detection and
formats. Rapid detection of the presence or absence of a ranking of a GST-tagged protein spiked into conditioned CHO
target protein and relative ranking of concentration are simple cell media at varying concentrations. The Anti-GST Biosensor
yet important functionalities that can provide critical informa- (ForteBio part no. 18-5096) consists of a high affinity anti-GST
tion at various stages in research, process development and antibody immobilized on the biosensor surface, allowing for
1
Page2
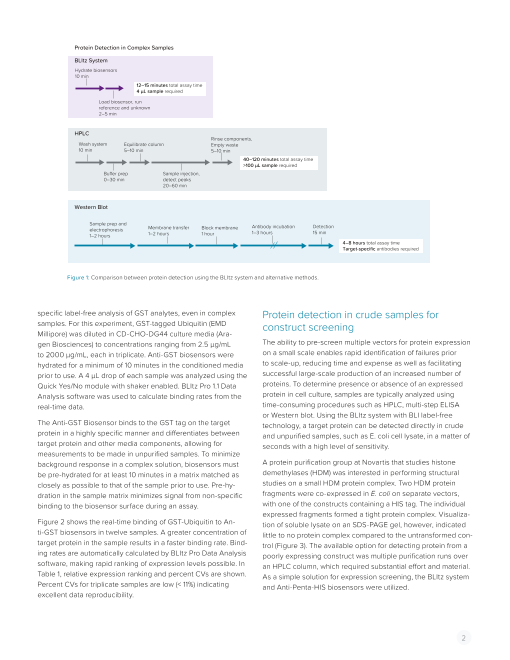
Protein Detection in Complex Samples
BLItz System
Hydrate biosensors
10 min
12–15 minutes total assay time
4 µL sample required
Load biosensor, run
reference and unknown
2–5 min
HPLC
Rinse components,
Wash system Equilibrate column Empty waste
10 min 5–10 min 5–10 min
40–120 minutes total assay time
>100 µL sample required
Buer prep Sample injection,
0–30 min detect peaks
20–60 min
Western Blot
Sample prep and
electrophoresis Membrane transfer Block membrane Antibody incubation Detection
1–2 hours 1–2 hours 1 hour 1–3 hours 15 min
4–8 hours total assay time
Target-specific antibodies required
Figure 1: Comparison between protein detection using the BLItz system and alternative methods.
specific label-free analysis of GST analytes, even in complex Protein detection in crude samples for
samples. For this experiment, GST-tagged Ubiquitin (EMD construct screening
Millipore) was diluted in CD-CHO-DG44 culture media (Ara-
gen Biosciences) to concentrations ranging from 2.5 µg/mL The ability to pre-screen multiple vectors for protein expression
to 2000 µg/mL, each in triplicate. Anti-GST biosensors were on a small scale enables rapid identification of failures prior
hydrated for a minimum of 10 minutes in the conditioned media to scale-up, reducing time and expense as well as facilitating
prior to use. A 4 µL drop of each sample was analyzed using the successful large-scale production of an increased number of
Quick Yes/No module with shaker enabled. BLItz Pro 1.1 Data proteins. To determine presence or absence of an expressed
Analysis software was used to calculate binding rates from the protein in cell culture, samples are typically analyzed using
real-time data. time-consuming procedures such as HPLC, multi-step ELISA
or Western blot. Using the BLItz system with BLI label-free
The Anti-GST Biosensor binds to the GST tag on the target technology, a target protein can be detected directly in crude
protein in a highly specific manner and differentiates between and unpurified samples, such as E. coli cell lysate, in a matter of
target protein and other media components, allowing for seconds with a high level of sensitivity.
measurements to be made in unpurified samples. To minimize
background response in a complex solution, biosensors must A protein purification group at Novartis that studies histone
be pre-hydrated for at least 10 minutes in a matrix matched as demethylases (HDM) was interested in performing structural
closely as possible to that of the sample prior to use. Pre-hy- studies on a small HDM protein complex. Two HDM protein
dration in the sample matrix minimizes signal from non-specific fragments were co-expressed in E. coli on separate vectors,
binding to the biosensor surface during an assay. with one of the constructs containing a HIS tag. The individual
expressed fragments formed a tight protein complex. Visualiza-
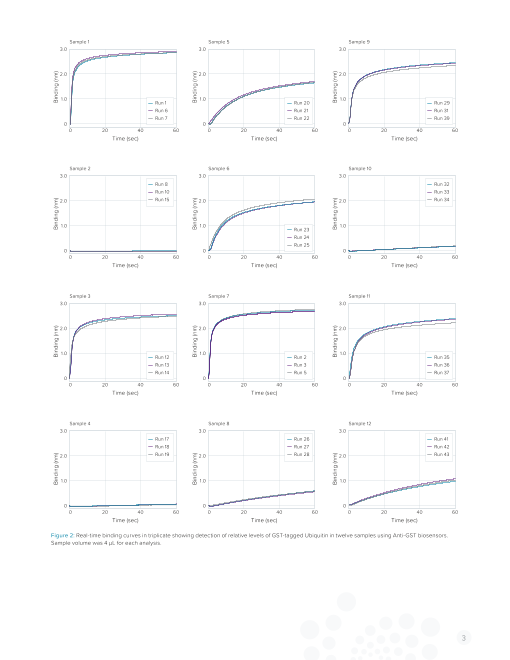
Figure 2 shows the real-time binding of GST-Ubiquitin to An- tion of soluble lysate on an SDS-PAGE gel, however, indicated
ti-GST biosensors in twelve samples. A greater concentration of little to no protein complex compared to the untransformed con-
target protein in the sample results in a faster binding rate. Bind- trol (Figure 3). The available option for detecting protein from a
ing rates are automatically calculated by BLItz Pro Data Analysis poorly expressing construct was multiple purification runs over
software, making rapid ranking of expression levels possible. In an HPLC column, which required substantial effort and material.
Table 1, relative expression ranking and percent CVs are shown. As a simple solution for expression screening, the BLItz system
Percent CVs for triplicate samples are low (< 11%) indicating and Anti-Penta-HIS biosensors were utilized.
excellent data reproducibility.
2
Page3
Sample 1 Sample 5 Sample 9
3.0 3.0 3.0
2.0 2.0 2.0
1.0 1.0 1.0
Run 1 Run 20 Run 29
Run 6 Run 21 Run 31
Run 7 Run 22 Run 39
0 0 0
0 20 40 60 0 20 40 60 0 20 40 60
Time (sec) Time (sec) Time (sec)
Sample 2 Sample 6 Sample 10
3.0 3.0 3.0
Run 8 Run 32
Run 10 Run 33
2.0 Run 15 2.0 2.0 Run 34
1.0 1.0 1.0
Run 23
Run 24
Run 25
0 0 0
0 20 40 60 0 20 40 60 0 20 40 60
Time (sec) Time (sec) Time (sec)
Sample 3 Sample 7 Sample 11
3.0 3.0 3.0
2.0 2.0 2.0
1.0 1.0 1.0
Run 12 Run 2 Run 35
Run 13 Run 3 Run 36
Run 14 Run 5 Run 37
0 0 0
0 20 40 60 0 20 40 60 0 20 40 60
Time (sec) Time (sec) Time (sec)
Sample 4 Sample 8 Sample 12
3.0 3.0 3.0
Run 17 Run 26 Run 41
Run 18 Run 27 Run 42
2.0 Run 19 2.0 Run 28 2.0 Run 43
1.0 1.0 1.0
0 0 0
0 20 40 60 0 20 40 60 0 20 40 60
Time (sec) Time (sec) Time (sec)
Figure 2: Real-time binding curves in triplicate showing detection of relative levels of GST-tagged Ubiquitin in twelve samples using Anti-GST biosensors.
Sample volume was 4 µL for each analysis.
3
Binding (nm) Binding (nm) Binding (nm) Binding (nm)
Binding (nm) Binding (nm) Binding (nm) Binding (nm)
Binding (nm) Binding (nm) Binding (nm) Binding (nm)
Page4
Rank Binding rate %CV Dilution series
Highest Sample 1 1.991 10.8% – + – + – + – + – +
expression
Sample 7 1.646 2.4%
Sample 3 13.73 3.5%
Sample 9 0.864 3.2%
Sample 11 0.614 2.2%
Sample 6 0.230 3.7%
Sample 5 0.112 0.6%
Sample 12 0.031 4.3%
Sample 8 0.015 2.0%
Lowest Sample 10 0.004 4.3% Figure 3: Coomassie stained SDS-PAGE gel analysis of HDM protein fragments
co-expressed in E. coli. Soluble lysates from transformed (+) and negative control
expression Sample 4 0.002 8.9% (–) cultures were normalized for protein content, then serially diluted and loaded
onto the gel. Arrows indicate expected migration of the two fragments of the
Sample 2 0.000 NA HDM complex. No obvious expressed bands can be visualized above back-
ground in transformed samples.
Table 1: Expression ranking using the calculated binding rates. Percent CVs were
calculated from the triplicate data shown in Figure 2.
Anti-Penta-HIS biosensors (ForteBio part no. 18-5077) come from this construct to be adequate for crystallography studies.
with the highly specific Penta-HIS antibody from Qiagen pre-im- In this example, the presence of target protein complex was de-
mobilized on the biosensor surface. The biosensor enables tected in five minutes using a drop of sample, with no need for
specific detection and quantitation of HIS-tagged proteins in purification and with greater sensitivity than SDS-PAGE. Rapid
purified or partially purified samples, cell culture supernatants detection of an expressed protein directly in crude samples
or cell lysates. Binding of a HIS-tagged protein to the biosensor demonstrates how the BLItz system can save time and resourc-
can be monitored in real time. es when evaluating constructs for scale-up.
E. coli cell cultures containing HDM constructs and untrans-
formed negative control were harvested and lysed by resus- Highly specific detection of fab fragments in
pending in BugBuster™ reagent (Novagen) with benzonase and the presence of free light chains
protease inhibitors. After clearing by centrifugation and filtra- Often in production of recombinant IgG and Fab fragments,
tion, total protein content was normalized via Bradford assay. over-expression of light chains can become an issue. Because
Lysates were then diluted 1:10 with PBS buffer. Diluted negative the majority of available Fab binding agents target epitopes
control lysate was used to pre-hydrate biosensors. A 4 µL drop that reside on the antibody light chain, accurate quantitation
of each sample was loaded into the BLItz system and detection becomes problematic due to ligand cross-binding to contami-
performed using the Quick Yes/No module. nating free light chains (Figure 5). By using an affinity ligand that
Typically, matrix effects can cause non-specific binding, targets the CH1 domain on the heavy chain of a Fab fragment,
increased drift, or interfere with the binding of a protein to the this problem can be eliminated. ForteBio recently launched
biosensor. When measuring proteins in crude samples such its Anti-Human Fab-CH1 Dip and Read Biosensor for highly
as complex media or cell lysate, it is recommended that the specific binding to the CH1 region of human Fab, F(ab’)2 and
samples be diluted appropriately with ForteBio Sample Diluent IgG. Anti-Human Fab-CH1 biosensors exhibit no cross-binding
(part no. 18-5028) to mitigate these effects. In this experiment, to antibody light chains, and when used in conjunction with the
samples were diluted 1:10, however a dilution factor of 50 to BLItz system offer a fast and simple method for differentiation of
100-fold may be required depending on the nature of the sam- Fab/F(ab’)2 fragments and contaminating light chain species.
ples and the type of biosensor being utilized. To demonstrate the high level of specificity of the Anti-Human
Figure 4 shows real-time binding data for the HDM expressor Fab-CH1 biosensors, the effect of free light chains on the detec-
and the negative control. Only the lysate sample containing tion of a human Fab fragment was investigated. A purified Fab
the HDM protein constructs generates a positive signal when fragment derived from whole human IgG (Jackson ImmunoRe-
compared to the negative control, indicating the presence of search) was diluted to 10 µg/mL in Sample Diluent (ForteBio part
the target protein complex in the co-expression line. Subse- no. 18-5028). Sample Diluent was also used to pre-wet Anti-Hu-
quent HPLC analysis showed the yield of HDM protein complex man Fab-CH1 biosensors (ForteBio part no. 18-5104) and Protein
L biosensors (ForteBio part no. 18-5085) for at least 10 minutes.
4
Page5
0.6
Anti-Human
Fab-CH1 Protein L
0.5 Intact Fab fragments
Free kappa light chains
0.4 - monomer LC
- dimer LC2
0.3
0.2
Figure 5: Selectivity of Anti-Human Fab-CH1 vs. Protein L biosensors for intact
0.1 Negative Control Fab fragments.
HDM Transformed
0
Streptavidin biosensors for confirmation of
-0.1
0 50 100 150 200 250 300 protein biotinylation
Time (sec)
Biotinylation of proteins is a common strategy in many protein
Figure 4: Real-time binding data from transformed and untransformed negative
control E. coli lysates. Soluble lysates were normalized for protein content and research applications as a way to take advantage of the ex-
diluted 1:10. A 4 µL drop per sample was loaded, then binding to Anti-Penta-HIS tremely high affinity interaction of biotin to avidin and strepta-
biosensors was measured in real time for 300 seconds. Data was reference-sub-
tracted using the negative control sample. The positive nm shift in the trans- vidin. Biotin and avidin/streptavidin have become standard
formed lysate indicates the presence of the HIS-tagged HDM protein complex. reagents for a diverse array of detection and immobilization
methods utilized in applications such as ELISA, Western blot,
immunoprecipitation, affinity purification and flow cytometry. A
Purified free human kappa light chain from Bence Jones protein variety of biotinylation reagents with different functional group
(Meridian Life Science) was spiked into Fab fragment samples specificities are available for biotin conjugation to proteins.
to final concentrations ranging from 0.5 µg/mL to 50 µg/mL. However, issues can arise with biotinylation procedures includ-
Binding analysis was performed on Protein L and Anti-Human ing protein loss, inactivation and uncertainty as to whether the
Fab-CH1 biosensors using the Quick Yes/No module for 60 conjugation reaction was successful (Figure 8).
seconds per sample with shaker enabled.
The Quick Yes/No module on the BLItz system combined with
Results of the binding comparison experiment are displayed Streptavidin biosensors (ForteBio part no. 18-5019) provides a
in Figures 6 and 7. Figure 6 shows real-time binding data for useful tool to quickly check for successful biotinylation. Confir-
human Fab samples to each biosensor type. Note that the mation of binding to Streptavidin biosensors can be assessed
binding curves were unaffected on the Anti-Human Fab-CH1 in a matter of seconds, and only 4 µL of reaction mixture is
biosensors, as compared to the Protein L biosensors where the required. To illustrate, a human/mouse IL-5 monoclonal anti-
binding response increased. This is suggestive of co-binding of body (R&D Systems) was biotinylated at a 1:1 molar coupling
free light chains by Protein L. A graph comparing binding rates ratio (MCR) using EZ-Link® NHS-PEG4 biotin (Thermo Scientific).
between the two biosensors is shown in Figure 7. These data A sample with no biotin was also run in parallel as a negative
clearly show that increased binding rate to Protein L biosen- control. Reactions were then desalted using Zeba desalting
sors corresponds to higher concentration of free light chain, spin columns (Thermo Scientific). After desalting, concentra-
whereas binding to Anti-Human Fab-CH1 remains constant. This tions for each sample were determined spectrophotometrically
high specificity of Fab binding makes the Anti-Human Fab-CH1 and normalized with PBS. Streptavidin biosensors were pre-wet
Biosensor an extremely useful tool for pre-purification detec- for at least 10 minutes in Sample Diluent. Biotinylated IL-5 mAb
tion and analysis of Fab samples. A range of biosensors are samples were then diluted to 100 µg/mL using Sample Diluent.
available for use on the BLItz system with high specificity for Loading on Streptavidin biosensors was performed in 4 µL of
analysis in complex matrices. For example, Anti-Mouse IgG Fc each sample with shaking for 30 seconds.
(ForteBio part no. 18-5088) and Anti-Human IgG Fc (ForteBio
part no. 18-5060) biosensors offer selective capture of mouse
or human IgGs respectively. In addition, Streptavidin biosensors
can be loaded with a biotinylated molecule of choice, for an
unlimited range of assays.
5
Binding (nm)
Page6
2.0 Anti-Human Fab-CH1 Protein L
5
1.8
1.6
4
1.4
1.2
3
1
0.8 2
0.6 50 µg/mL 2.5 µg/mL 50 µg/mL 2.5 µg/mL
25 µg/mL 1.0 µg/mL 25 µg/mL 1.0 µg/mL
0.4 1
10 µg/mL 0.5 µg/mL 10 µg/mL 0.5 µg/mL
0.2 5 µg/mL 0 µg/mL 5 µg/mL 0 µg/mL
0 0
0 10 20 30 40 50 60 0 10 20 30 40 50 60
Time (sec) Time (sec)
Figure 6: Effect of free kappa light chains on detection of human Fab fragments using Anti-Human Fab-CH1 biosensors (left) compared to Protein L biosensors (right).
Varying levels of human kappa light chain were spiked into samples containing 10 µg/mL human Fab fragment and analyzed on both biosensor types. Real-time binding
data is shown. Increased response on Protein L biosensors indicates cross-reactivity to free light chains and consequently, unreliable results for specific measurement
of Fab concentration.
Figure 9 shows the real time run data for loading biotinylated
IL-5 mAb onto the Streptavidin biosensors. No binding response Protein L
Anti-hu Fab-CH1
was evident in the sample without biotin. In contrast, the 1.2
biotinylated sample showed a very strong binding response,
demonstrating that a successful conjugation reaction can be
quickly confirmed.
0.8
Tips for running quick yes/no analysis for
protein presence
• Cell lysates or supernatants must be pre-cleared of insoluble 0.4
debris prior to analysis.
• Dilute crude samples such as cell lysates appropriately to
mitigate matrix effects. Dilution recommendations are biosen- 0
0.1 1 10 100
sor-dependent and can be found in corresponding biosensor µg/mL Free Light Chain
technical notes (fortebio.com/literature.html).
Figure 7: Effect of free kappa light chains on detection of human Fab fragments
• Pre-hydrate biosensors for at least 10 minutes in buffer matrix using Anti-Human Fab-CH1 biosensors compared to Protein L biosensors. Vary-
that exactly matches the sample to be analyzed. This will ing levels of human kappa light chain were spiked into samples containing 10 µg/
mL of human Fab fragment and analyzed on both biosensor types. Increased
minimize background response from non-specific binding to response on Protein L biosensors indicates cross-reactivity to free light chains.
the biosensor surface.
• Run a reference or negative control sample that matches the
matrix of the sample to be analyzed but does not contain
the protein of interest. This will allow for subtraction of any
response signal generated by non-specific binding to the
biosensor surface.
6
Binding (nm)
Binding Rate (nm/s) Binding (nm)
Page7
Streptavidin Streptavidin Streptavidin Streptavidin
biosensor biosensor biosensor
Antibody
Biotin
Successful biotinylation: Unsuccessful biotinylation: Successful biotinylation without desalting:
Biotinylated antibodies bind to No biotin present to attach Free biotin competes for binding to
streptavidin, giving a strong positive antibodies to streptavidin. Zero streptavidin. Zero to very low binding
binding response. binding response. response.
Figure 8: Use of Streptavidin biosensors and the Quick Yes/No module to confirm successful bioconjugation reaction. Biotinylation of an antibody is used to illustrate
three possible scenarios: successful biotinylation and desalting, unsuccessful biotinylation or successful biotinylation without desalting. A strong binding response will
only be observed upon successful biotinylation followed by efficient desalting to remove unincorporated biotin.
5
References
1 BLItz Quick Start Guide: Provided with all BLItz systems. Current version can
4 be downloaded from www.blitzmenow.com/literature.html.
2 BLItz Demo and Starter Guide: Provides detailed step-by-step guidance on
setting up assays using the BLItz starter kit.
3
3 ForteBio Technical Note 28: Biotinylation of protein for immobilization onto
Streptavidin biosensors. www.fortebio.com/literature.html.
2 4 ForteBio Technical Note 10: Batch immobilization of a biotinylated ligand
onto Streptavidin biosensors. www.fortebio.com/literature.html.
5 ForteBio Technical Note 11: Biotinylating in antibody stocks containing
1 No biotin carrier protein. www.fortebio.com/literature.html.
1:1
0 BLItz system ordering and contact
information
-1 • To request a quote, visit www.fortebio.com/blitz.html and click
0 5 10 15 20 25 30
Time (sec) Get Quote.
Figure 9: Effect of biotinylation on binding to Streptavidin biosensors. IL-5 • For a list of available biosensor types, visit
monoclonal antibody was biotinylated using a 1:1 molar coupling ratio. A sample www.fortebio.com/biosensor-types.html.
with zero biotin gives no signal, however the conjugated sample shows a strong
binding response. • For technical support, go to www.fortebio.com/support.
Conclusion
We have demonstrated several applications in which the Quick
Yes/No module on the BLItz system can be utilized to improve
workflows when paired with a wide selection of pre-immobi-
lized biosensors. The ability to qualitatively measure target pro-
teins directly in complex matrices using 4 µL of sample allows
rapid, simple and powerful analyses on the BLItz system that is
not possible with other platforms.
ForteBio ForteBio Analytics (Shanghai) Co., Ltd. Molecular Devices (UK) Ltd. Molecular Devices (Germany) GmbH
47661 Fremont Boulevard No. 88 Shang Ke Road 660-665 Eskdale Bismarckring 39
Fremont, CA 94538 Zhangjiang Hi-tech Park Winnersh Triangle 88400 Biberach an der Riss
888.OCTET-75 or 650.322.1360 Shanghai, China 201210 Wokingham, Berkshire Germany
www.fortebio.com fortebio.info@moldev.com salesops.china@moldev.com RG41 5TS, United Kingdom + 00800 665 32860
+44 118 944 8000
uk@moldev.com
©2019 Molecular Devices, LLC. All trademarks used herein are the property of Molecular Devices, LLC. Specifications subject to change without
notice. Patents: www.moleculardevices.com/product patents. FOR RESEARCH USE ONLY. NOT FOR USE IN DIAGNOSTIC PROCEDURES.
AN-4004 Rev D
Binding (nm)