


R&S NRT2, R&S NRT-Z14 and R&S NRT-Z44
Directional power sensors measure forward and reverse power under operating conditions. These measurements are required when installing, servicing and monitoring transmitters, antennas and RF generators. The R&S NRT family consists of the R&S NRT2 power reflection meter and various R&S NRT-Zxx directional power sensors. Thanks to their wide range of measurement functions and high accuracy, they are suitable for use in research, development and production.
このカタログについて
| ドキュメント名 | R&S NRT パワー・リフレクションメータ |
|---|---|
| ドキュメント種別 | 製品カタログ |
| ファイルサイズ | 2Mb |
| 登録カテゴリ | |
| 取り扱い企業 | ローデ・シュワルツ・ジャパン株式会社 (この企業の取り扱いカタログ一覧) |
この企業の関連カタログ


このカタログの内容
Page1
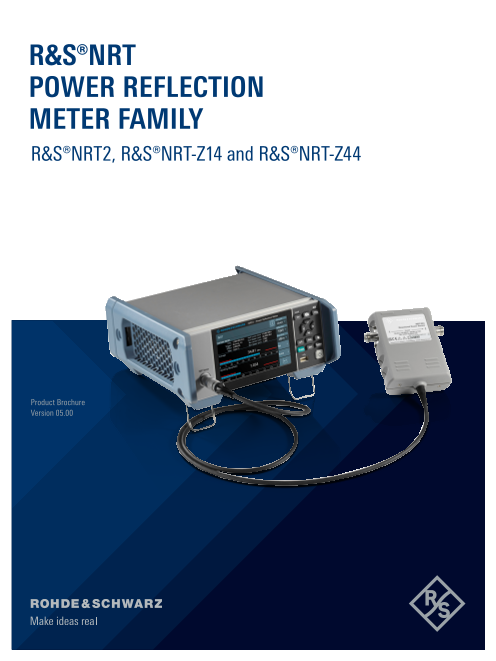
R&S®NRT
POWER REFLECTION
METER FAMILY
R&S®NRT2, R&S®NRT-Z14 and R&S®NRT-Z44
Product Brochure
Version 05.00
Product Brochure
Version 05.00
Page2
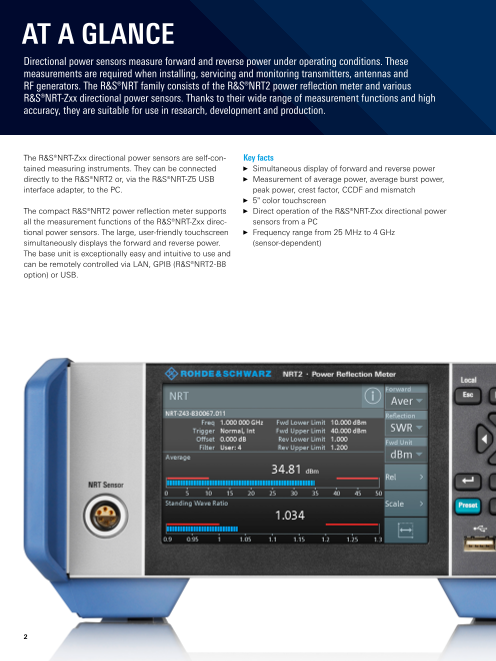
AT A GLANCE
Directional power sensors measure forward and reverse power under operating conditions. These
measurements are required when installing, servicing and monitoring transmitters, antennas and
RF generators. The R&S®NRT family consists of the R&S®NRT2 power reflection meter and various
R&S®NRT-Zxx directional power sensors. Thanks to their wide range of measurement functions and high
accuracy, they are suitable for use in research, development and production.
The R&S®NRT-Zxx directional power sensors are self-con- Key facts
tained measuring instruments. They can be connected ► Simultaneous display of forward and reverse power
directly to the R&S®NRT2 or, via the R&S®NRT-Z5 USB ► Measurement of average power, average burst power,
interface adapter, to the PC. peak power, crest factor, CCDF and mismatch
► 5" color touchscreen
The compact R&S®NRT2 power reflection meter supports ► Direct operation of the R&S®NRT-Zxx directional power
all the measurement functions of the R&S®NRT-Zxx direc- sensors from a PC
tional power sensors. The large, user-friendly touchscreen ► Frequency range from 25 MHz to 4 GHz
simultaneously displays the forward and reverse power. (sensor-dependent)
The base unit is exceptionally easy and intuitive to use and
can be remotely controlled via LAN, GPIB (R&S®NRT2-B8
option) or USB.
2
Page3
BENEFITS
R&S®NRT2 power reflection meter
► Simple touchscreen operation
► Simultaneous display of forward and reverse power
► Analog bargraph and autoscale
► Visual limit monitoring
► 100 % code compatibility with predecessor model
► page 4
R&S®NRT-Zxx directional power sensors
► Various sensor models
► Diverse measurement functions
► Direct power monitoring on a PC
► page 5
Versatile applications
► Continuous monitoring of transmitter systems
► Power measurements with digital modulation
► page 7
3 Rohde & Schwarz R&S®NRT Power Reflection Meter Family 3
Page4
R&S®NRT2 POWER
REFLECTION METER
Simple touchscreen operation
Thanks to intelligent menus, the compact R&S®NRT2 base
unit with a state-of-the-art 5" touchscreen is extremely
easy to operate. On the top menu level, users can switch
between the most important measurements. Additional
parameters can be set in clearly structured submenus.
Important functions such as setting frequencies, zeroing
and creating screenshots can be accessed at the push of
a button.
Simultaneous display of forward and reverse power
The R&S®NRT-Z14 and R&S®NRT-Z44 directional power sen-
Analog bar graph with configurable limits sors simultaneously measure forward and reverse power
and calculate additional parameters such as load matching.
The R&S®NRT2 power reflection meter then displays one
forward and one reverse parameter at the same time.
The forward measurement function shows the average
power, average burst power, peak envelope power (PEP)
and the peak-to-average power ratio (crest factor). The cal-
culated absorption average power (forward minus reverse),
absorption burst power, absorption PEP and amplitude
distribution (CCDF) for modulated signals can also be
displayed.
The reflection measurement function displays the average
power, return loss, SWR, reflection coefficient and reflec-
tion ratio in %.
Analog bargraph and autoscale
Forward measurement function Measurements can be shown as numeric values or in an
analog bargraph. To define the analog measuring range,
the user starts the autoscale function by simply pressing
a button. The scale of the analog bargraph is optimally
adjusted to the measured signal.
Visual limit monitoring
Each measurement can be visually monitored. Values out-
side the defined limits are highlighted in red. The analog
bargraph additionally graphically displays the defined lim-
its in red.
100 % code compatibility with predecessor model
The remote commands of the R&S®NRT2 are 100 %
code compatible with the command set of the previous
R&S®NRT model. This simplifies device replacement and
integration into existing systems (no additional program-
ming required). The R&S®NRT2 power reflection meter can
be remote controlled via USB or LAN. The R&S®NRT2-B8
Reflection measurement function option adds remote control via GPIB (IEEE 488).
4
Page5
R&S®NRT-ZXX DIRECTIONAL
POWER SENSORS
Various sensor models Peak envelope power (PEP) and crest factor
The R&S®NRT-Z44 directional power sensor is Both parameters provide information on the peak power
tailor-made to meet the requirements of all common of a modulated envelope and describe the overdrive char-
radiocommunications standards: acteristics of transmitter output stages. The result of the
► The wide frequency range from 200/400 MHz to 4 GHz crest factor measurement is referenced to the average
covers all relevant frequency bands power and displayed in dB. Measurements are performed
► The measurement method is compatible with all using a video bandwidth that is adjustable in several steps,
common analog and digital modulation standards so that even short-time and high-power peaks can be
determined.
The R&S®NRT-Z14 directional power sensor (25 MHz to
1 GHz) can be used in traditional analog radio and broad- Average burst power
cast frequency bands. This function can be used to measure modulated and
unmodulated bursts based on the average power and the
Diverse measurement functions duty cycle. Both can be defined by the user or determined
The R&S®NRT-Z14 and R&S®NRT-Z44 power sensors sup- automatically by the power sensor.
port the following measurement functions.
Complementary cumulative distribution function (CCDF)
Average power (RMS value) This function measures the probability of the peak enve-
This function returns the average value of the power for lope power exceeding a preset threshold so that the ampli-
any type of test signal (modulated, unmodulated or sev- tude distribution of signals with an unknown envelope can
eral carriers). It features a measurement range of 35 dB to be determined.
40 dB and high measurement accuracy.
Rohde & Schwarz R&S®NRT Power Reflection Meter Family 5
Page6
Direct power monitoring on a PC
The R&S®NRT-Zxx directional power sensors are fully cali-
brated, independent measuring instruments that can also
be used without the base unit. The R&S®NRT-Z5 USB inter-
face adapter enables direct connection to a laptop/PC.
The R&S®NRT-Z14 and R&S®NRT-Z44 power sensors
make high-precision power and reflection measurements
extremely cost-effective. Direct monitoring on a PC is very
useful in applications where data needs to be collected
(e.g. in development labs and for maintenance of base sta-
tions) as well as for purely remote controlled applications
such as power monitoring in transmitter stations and EMC
test systems. The R&S®Virtual-NRT Windows user interface
(provided as a free download) allows users to define mea-
surement functions and also display and store individual
results and series of measurements.
6
Page7
VERSATILE APPLICATIONS
Continuous monitoring of transmitter systems Power measurements with digital modulation
Many applications need continuous monitoring of power Conventional directional power meters only measure RF
and reflection, e.g. to enable fast reaction times when and microwave signals that have an unmodulated enve-
an antenna is damaged. This requires a highly accu- lope. The R&S®NRT-Z14 and R&S®NRT-Z44 directional
rate measuring instrument that does not influence the power sensors have been designed to also meet the
SWR and attenuation of the antenna feeder and does not requirements of digitally modulated signals. The key fac-
generate any interfering signals. The R&S®NRT-Z14 and tor is their ability to correctly measure the average power
R&S®NRT-Z44 directional power sensors feature good (RMS value) of a signal irrespective of its envelope. The
matching, low insertion loss and excellent intermodula- sensors behave like a thermal power meter and offer the
tion characteristics. When a multicarrier signal is applied, best accuracy and measurement range (35 dB to 40 dB).
the sum power is displayed – a feature rarely found in con-
ventional directional power sensors. Since data is digitally For TDMA systems, the average burst power function
transferred, the length of the connecting cable is not criti- makes it possible to measure transmitter power in an
cal and the R&S®NRT-Z14 and R&S®NRT-Z44 directional active timeslot. If several timeslots are active (e.g. base
power sensors can be installed where they measure most stations), the average power function can determine the
accurately – at the antenna feed point. average power over all timeslots. The peak envelope
power function can measure overshoots at the beginning
of a timeslot or peak values caused by modulation down
to a minimum duration of 200 ns (R&S®NRT-Z44) or 1.5 µs
(R&S®NRT-Z14).
When measuring CDMA signals with the ¸NRT-Z44
directional power sensors, both the peak envelope power
function and the average power function can be used.
The peak envelope power function measures the short-
time peak values that are approx. 10 dB above the average
value. This provides information about the overdrive capa-
bility of the transmitter output stage. The peak envelope
power can be displayed as an absolute value in W or dBm
or as a relative value in dB referenced to the average value
(crest factor).
Rohde & Schwarz R&S®NRT Power Reflection Meter Family 7
Page8
SPECIFICATIONS
R&S®NRT-Z14/-Z44 directional power sensors
R&S®NRT-Z14 R&S®NRT-Z44
General data (max. power, see diagram)
1) 0.006 W to 120 W (average), 0.003 W to 120 W (average),
Power measurement range
300 W (peak) 300 W (peak)
Frequency range 25 MHz to 1 GHz 200 MHz to 4 GHz
► 0.2 GHz to 3 GHz: ≤ 1.07
SWR (referenced to 50 Ω) ≤ 1.06
► 3 GHz to 4 GHz: ≤ 1.12
► 0.2 GHz to 1.5 GHz: ≤ 0.06 dB, typ. ≤ 0.04 dB
Insertion loss ≤ 0.06 dB, typ. ≤ 0.04 dB
► 1.5 GHz to 4 GHz: ≤ 0.10 dB, typ. ≤ 0.07 dB
► 0.2 GHz to 3 GHz: ≥ 30 dB
Directivity 2) ≥ 30 dB
► 3 GHz to 4 GHz: ≥ 26 dB
Average power measurement 3), 4)
mean value of carrier power, averaged over several modulation cycles (thermal equivalent, true RMS value in
Definition
case of voltage measurement)
►
5) CW, FM, φM, FSK or GMSK: ► CW, FM, φM, FSK or GMSK:
Power measurement range
0.03 [0.006] W to 300 W 0.03 [0.006] W to 300 W
CF (crest factor): peak-to-average
► other modulation modes: ► other modulation modes:
ratio
0.03 [0.006] W to 300 [50] W/CF 6) 0.03 [0.006] W to 300 [50] W/CF 6)
for all types of analog and digital modulation; lowest frequency component of signal envelope should exceed
Modulation
7 Hz for steady indication
►
7) from 40 MHz to 1 GHz: 3.2 % of rdg (0.14 dB) 8) ► from 0.3 GHz to 4 GHz: 3.2 % of rdg (0.14 dB) 9)
Measurement uncertainty from
► from 25 MHz to 40 MHz: 4.0 % of rdg (0.17 dB) 8) ► from 0.2 GHz to 0.3 GHz: 4.0 % of rdg (0.17 dB) 9)
+18 °C to +28 °C, CW signal
plus zero offset plus zero offset
Modulated signal same as CW signal, plus errors due to modulation
Zero offset ±0.004 [±0.0008] W 10) ±0.004 [±0.0004] W 10)
► FM, φM, FSK, GMSK: ±0 % of rdg (0 dB)
► AM (80 %): ±3 % of rdg (±0.13 dB)
► cdmaOne, DAB 12): ±1 % of rdg (±0.04 dB)
► FM, φM, FSK, GMSK: ±0 % of rdg (0 dB)
► CDMA2000® (3X) 13): ±2 % of rdg (±0.09 dB)
► AM (80 %): ±3 % of rdg (±0.13 dB)
Typical errors due to modulation 11) ► 12)
12) EDGE : ±0.5 % of rdg (±0.02dB)
► EDGE, TETRA : ±0.5 % of rdg (±0.02 dB)
► WCDMA 14): ±2 % of rdg (±0.09 dB)
► 2 CW carriers: ±2.0 % of rdg (±0.09 dB)
► DVB-T 12): ±2 % of rdg (±0.09 dB)
► π/4 DQPSK: ±2 % of rdg (±0.09 dB)
► 2 CW carriers: ±2 % of rdg (±0.09 dB)
► ►
15) 40 MHz to 1 GHz: 0.25 %/K (0.011 dB/K) 0.3 GHz to 4 GHz: 0.25 %/K (0.011 dB/K)
Temperature coefficient
► 25 MHz to 40 MHz: 0.40 %/K (0.017 dB/K) ► 0.2 GHz to 0.3 GHz: 0.40 %/K (0.017 dB/K)
Measurement time/averaging
► 0 W to 0.2 W: 1.31 (4.83) s/32 (128) ► 0 W to 0.2 W: 1.31 (4.83) s/32 (128)
factor 16)
► 0.2 W to 2 W: 0.27 (1.31) s/4 (32) ► 0.2 W to 2 W: 0.27 (1.31) s/4 (32)
Values in ( ) for high resolution
► 2 W to 300 W: 0.18 (0.27) s/1 (4) ► 2 W to 300 W: 0.18 (0.27) s/1 (4)
setting
Average burst power measurement 3), 4)
Video bandwidth settings in { }
average power value of periodic RF bursts based on the measurement of the average power under consideration
Definition of burst width t and repetition rate 1/T: average burst power = average power × T/t
t and T can be predefined (calculate mode) or measured (measure mode)
Power measurement range
0.03 [0.006] W × (T/t) 0.03 [0.003] W × (T/t)
Calculate mode 5) up to specified upper limit of average power up to specified upper limit of average power
measurement measurement
Measure mode (only with forward
direction 1 ▷ 2)
same as calculate mode, but at least 2 (4) W same as calculate mode, but at least 2 (5) W
Values in ( ) for “FULL“ video
b andwidth setting
Burst width (t)
Calculate mode 0.2 µs to 150 ms 0.2 µs to 150 ms
► 500 µs to 150 ms {4 kHz} ► 500 µs to 150 ms {4 kHz}
Measure mode ► 10 µs to 150 ms {200 kHz} ► 10 µs to 150 ms {200 kHz}
► 2 µs to 150 ms {“FULL”} ► 1 µs to 150 ms {“FULL“}
Repetition rate (1/T) min. 7/s
8
Page9
R&S®NRT-Z14/-Z44 directional power sensors
R&S®NRT-Z14 R&S®NRT-Z44
Duty cycle t/T
Calculate mode as defined by burst width and repetition rate
Measure mode 0.01 to 1
Measurement uncertainty from +18 °C to +28 °C
Calculate mode same as for average power measurement; stated zero offset multiplied by T/t
Measure mode same as for calculate mode plus 2 % of rdg (0.09 dB) at 0.1 duty cycle 17)
Temperature coefficient same as for average power measurement
Measurement time/averaging factor 16)
see average power measurement with corresponding average power value (average burst power multiplied
Calculate mode
by t/T)
Measure mode with 0.1 duty cycle
► 2 W to 20 W: 1.6 (9.5) s/4 (32) ► 2 W to 20 W: 1.6 (9.5) s/4 (32)
Values in ( ) for high resolution
► 20 W to 300 W: 0.75 (1.6) s/1 (4) ► 20 W to 300 W: 0.75 (1.6) s/1 (4)
setting
Crest factor measurement
Definition ratio of peak envelope power to average power in dB (only with 1 ▷ 2 forward direction)
Power measurement range see average power and peak envelope power specifications
Measurement uncertainty approx. 4.3 dB × (measurement error of peak hold circuit in W divided by peak envelope power)
Measurement time/averaging factor see specifications for peak envelope power measurement with simultaneous reflection measurement
Peak envelope measurement (PEP) 3)
Video bandwidth settings in { }
Definition peak value of carrier power (only with 1 ▷ 2 forward direction)
Power measurement range
► from 100 μs width {4 kHz}: 0.4 W to 300 W
► from 100 µs width {4 kHz}: 0.4 W to 300 W
Burst signals ► from 4 μs width {200 kHz}: 1 W to 300 W
► from 4 µs width {200 kHz}: 1 W to 300 W
(repetition rate min. 20/s) ► from 1 μs width {“FULL“}: 2 W to 300 W
► from 2 µs width {“FULL“}: 2 W to 300 W
► from 0.5 µs width {“FULL”}: 8 W to 300 W
cdmaOne, WCDMA, CDMA2000®, 4 W to 300 W {“FULL“ with modulation correction
DAB, DVB-T switched on}
Other signal type see burst signal of equivalent burst width
Measurement uncertainty from
same as for average power measurement, plus measurement error of peak hold circuit
+18 °C to +28 °C
Measurement error limits of peak
► from 200 µs {4 kHz}: ±(3 % of rdg + 0.05 W) 10)
hold circuit for burst signals with ► from 200 µs {4 kHz}: ±(3 % of rdg + 0.05 W) 10)
► from 4 µs {200 kHz}: ±(3 % of rdg + 0.2 W) 10)
specified burst width, repeti- ► from 4 µs {200 kHz}: ±(7 % of rdg + 0.2 W) 10)
► from 1 µs {“FULL“}: ±(7 % of rdg + 0.4 W) 10)
tion rate > 100/s, duty cycle from ► from 2 µs {“FULL“}: ±(7 % of rdg + 0.4 W) 10)
► from 0.5 μs {“FULL“}: ±(12 % of rdg + 0.4 W) 10)
0.1 to 1
At repetition rates from
add ±(1.6 % of rdg + 0.15 W) add ±(1.6 % of rdg + 0.15 W)
20/s to 100/s
► add ±0.10 W {200 kHz, “FULL“} ► add ±0.10 W {200 kHz, “FULL“}
At duty cycles from 0.001 to 0.1
► add ±0.05 W {4 kHz} ► add ±0.05 W {4 kHz}
Typical measurement errors of ► cdmaOne, DAB 12): ±(5 % of rdg + 0.4 W)
peak hold circuit with spread- ► CDMA2000® (3X) 13), WCDMA 14), DVB-T:
spectrum signals 18) ±(15 % of rdg + 0.4 W)
► 40 MHz to 1 GHz: 0.35 %/K (0.015 dB/K) ► 0.3 GHz to 4 GHz: 0.35 %/K (0.015 dB/K)
Temperature coefficient 15)
► 25 MHz to 40 MHz: 0.50 %/K (0.022 dB/K) ► 0.2 GHz to 0.3 GHz: 0.50 %/K (0.022 dB/K)
PEP measurement only (not possible in combination with the R&S®NRT2):
Measurement time/averaging ► 0.17 (0.27) s/1 (4) {4 kHz, 200 kHz}
factor 16) ► 0.30 (0.44) s/4 (8) {“FULL”}
Values in ( ) for high resolution with simultaneous reflection measurement:
setting ► 0.47 (1.14) s/1 (4) {4 kHz, 200 kHz}
► 1.14 (2.04) s/4 (8) {“FULL”}
Complementary cumulative distribution function measurement (CCDF)
Definition probability in % of forward power envelope exceeding a specified threshold (only with 1 ▷ 2 forward direction)
Measurement range 0 % to 100 %
Measurement uncertainty from
0.2 % 20)
+18 °C to +28 °C
Threshold level range 1 W to 300 W 1 W to 300 W
Rohde & Schwarz R&S®NRT Power Reflection Meter Family 9
Page10
R&S®NRT-Z14/-Z44 directional power sensors
R&S®NRT-Z14 R&S®NRT-Z44
Accuracy of threshold level
±(5 % of threshold level in W + 0.5 W) ±(5 % of threshold level in W + 0.5 W)
at +18 °C to +28 °C
Measurement time/averaging
factor 16) CCDF measurement only 19): 0.26 (0.37) s/1 (4)
Values in ( ) for high resolution with simultaneous reflection measurement (not possible in combination with the R&S®NRT2): 0.7 (1.6) s/1 (4)
setting
Reflection measurement 4)
Values in { }: 3 GHz to 4 GHz
Definition measurement of load match in terms of SWR, return loss, or reflection coefficient
Reflection measurement range
Return loss 0 to 23 dB 0 dB to 23 {20} dB
SWR 1.15 to ∞ 1.15 {1.22} to ∞
Reflection coefficient 0.07 to 1 0.07 {0.10} to 1
0.06 [0.3] W 0.03 [0.3] W
Min. forward power
(specs met from 0.4 [2] W) (specs met from 0.2 [2] W)
Measurement uncertainty see diagram
Measurement time/averaging factor same as measurement time of selected power measurement function, lowest with average power measurement
Figures
Maximum forward power of the R&S®NRT-Z44 Maximum forward power of the R&S®NRT-Z14 Measurement error limits (two standard deviations)
directional power sensors (for both directions) directional power sensor (for both directions) for reflection measurements with the R&S®NRT-Z14/
-Z44 directional power sensors
1000 6
Peak (max. 10 ms), SWR ≤ 3 1000
Avg –10 ºC to +35 ºC, Peak
800 800 SWR ≤ 1.5 (max. 10 ms)
SWR ≤ 3
600 Avg –10 ºC to +35 ºC, 4
SWR ≤ 1.5 600
Avg –10 ºC to +35 ºC, SWR ≤ 3
¸NRT-Z14
400 Avg –10 ºC to +35 ºC, 2
400 ¸NRT-Z44
SWR ≤ 3 (≤ 3 GHz)
0
Avg –10 ºC to +50 ºC, SWR ≤ 3 ¸NRT-Z44
Avg –10 ºC to +50 ºC, SWR ≤ 3 (3 GHz to 4 GHz)
200 200 –2
–4
100 100 0 5 10 15 20 25
0.2 0.4 0.7 1 2 3 4 25 100 205 400 600 800 1000 Return loss in dB
Frequency in GHz Frequency in MHz
Min. forward power (forward direction 1 ▷ 2): R&S®NRT-Z14: 0.4 W; R&S®NRT-Z44: 0.2 W
R&S®NRT-Z14/-Z44 directional power sensors
Measurement channels 2 (for forward and reverse power)
Forward direction 1 ▷ 2 standard for all measurement functions
only for measurement of average power and
2 ▷ 1
average burst power (at lower levels)
Measurement functions forward power and reflection
average power, average burst power, peak enve-
Power parameters lope power, peak-to-average ratio, complemen-
tary cumulative distribution function
return loss, SWR, reflection coefficient, reverse-
Reflection parameters
to-forward power ratio in %, reverse power
Range selection automatic
4 kHz, 200 kHz and ”FULL” (600 kHz for the
R&S®NRT-Z14, 4 MHz for the R&S®NRT-Z44) for
Video bandwidth
all power parameters except for the measure-
ment of the average power
on input of RF frequency, the stored correction
Frequency response correction
factors are taken into account
on remote command with RF power switched
Zero adjustment
off, duration approx. 5 s
RF connectors N (female) on both ends
10
Forward power in W
Forward power in W
Error limits in dB
Page11
R&S®NRT-Z14/-Z44 directional power sensors
Remote control
4.8/9.6/19.2 kbit/s or 38.4 kbit/s, 1 start bit,
RS-422 serial interface 8 data bits, 1 stop bit, no parity, XON/XOFF
handshake
Command set proprietary (not SCPI-compliant)
Environmental conditions
Temperature operating temperature range 0 °C to +50 °C (unless otherwise stated)
permissible temperature range –10 °C to +55 °C
storage temperature range –40 °C to +70 °C
+25 °C/+40 °C, 95 % rel. humidity, cyclic, in
Damp heat line with EN 60068-2-30 with restrictions:
noncondensing
Altitude operating or nonoperating max. 4600 m
Mechanical resistance
5 Hz to 55 Hz, 0.15 mm amplitude const.,
Vibration sinusoidal 55 Hz to 150 Hz, acceleration 0.5 g const.,
in line with EN 60068-2-6
10 Hz to 500 Hz, acceleration 1.9 g (RMS),
random
in line with EN 60068-2-64
40 g shock spectrum,
Shock in line with MIL STD-810E, method 516.4,
procedure I
Product conformity
applied harmonized standards:
Electromagnetic compatibility EU: in line with EMC Directive 2014/30/EU ► EN 61326-1 (industrial environment)
► EN 55011 (class B)
EU: in line with Directive 2011/65/EU on the
RoHS restriction of the use of certain hazardous sub- EN IEC 63000
stances in electrical and electronic equipment
General data
Power supply 6.5 V to 28 V, approx. 1.5 W
Length of connecting cable 1.5 m
Maximum length of extension cable operation via R&S®NRT2 500 m (approx. 1640 ft) 21)
operation via R&S®NRT-Z5 30 m (approx. 100 ft)
LEMO S series, FFP model, size 2, 6-pole plug
Cable plug (1: RXD+, 2: RXD−, 3: VSUPPLY, 4: GND, 5: TXD−,
6: TXD+)
120 mm × 95 mm × 39 mm
Dimensions W × H × D
(4.72 in × 3.74 in × 1.54 in)
Weight 0.65 kg (1.43 lb)
Calibration interval 2 years
R&S®NRT2 power reflection meter
Application power reflection meter
Sensors R&S®NRT-Z14, R&S®NRT-Z43, R&S®NRT-Z44
Sensor input one sensor input on front panel
LEMO S series, ERA model, size 2, 6-pole recep-
connector tacle (1: RXD+, 2: RXD−, 3: VSUPPLY, 4: GND,
5: TXD−, 6: TXD+)
Frequency range 25 MHz to 4 GHz (sensor-dependent)
0.0007 W to 120 W (average),
Power measurement range
max. 300 W (peak) (sensor-dependent)
Rohde & Schwarz R&S®NRT Power Reflection Meter Family 11
Page12
R&S®NRT2 power reflection meter
Measurement functions
Power forward power or power absorbed by the load
average power, average burst power, peak enve-
Forward power parameters lope power, peak-to-average ratio (crest factor),
complementary cumulative distribution function
display
absolute in W, dBm and dBµV
relative in dB, as change in percent (∆ %) or as quotient
SWR, return loss, reflection coefficient, reverse-
Reflection parameters
to-forward power ratio in %, reverse power
Measurement conditioning and filtering
on input of RF frequency, the stored correction
Frequency response correction
factors are taken into account
selectable with RF power switched off, duration
Zero adjustment
approx. 5 s
Averaging filter automatic or user-selectable
dependent on selected resolution of the mea-
automatic
surement result and characteristics of the sensor
user-selectable 1, 2, 4, 8, 16, 32, 64, 128, 256
display of current maximum, minimum or differ-
Maximum/minimum
ence (max. – min.)
Measurement uncertainty see sensor specifications
Display 127 mm (5") TFT color display
resolution 800 × 480 pixel (WVGA)
Manual operation via capacitive touch panel and/or keypad
Remote control
► IEC 60625.1 (IEEE 488.1)
Systems
► IEC 60625.2 (IEEE 488.2)
Command set SCPI-1999.0
IEC/IEEE bus (R&S®NRT2-B8 option) interface functions SH1, AH1, T6, L4, SR1, RL1, PP1, DC1, DT1, C0
connector 24-pin Amphenol (female)
USB USB 2.0 high-speed
connector USB type B receptacle
supported protocols USBTMC via VISA
LAN 10/100/1000BASE-T
connector RJ-45 modular socket
supported protocols VXI-11, HiSLIP, SCPI-RAW
Measurement time add 50 ms to sensor specifications
Analog outputs and trigger I/O
recorder output; user-definable linear relationship
Out 1/Trig Out Out 1 (analog output 1)
to measurement result
output voltage range 0 V to 2.5 V (no load)
output resistance 600 Ω (nom.)
accuracy of no-load output voltage ±(0.4 % of output voltage + 4 mV)
resolution 16 bit
update rate same as result rate of sensor
signaling output; user-definable logic levels for
Out 1/Trig Out (cont.) Trig Out (trigger output) the PASS and FAIL states in the case of limit
monitoring
► (5.1 ± 0.2) V (≥ 10 kΩ load)
high-level output voltage
► 2.6 V (nom.) (50 Ω load)
0 V to 0.4 V (meas.)
low-level output voltage
(5 mA sink current)
output impedance 50 Ω (nom.)
connector BNC (female)
12
Page13
R&S®NRT2 power reflection meter
input for trigger signals to sensor (rising edge is
Trig In/Out 2 Trig In (trigger input)
translated to RTRG command)
input impedance 10 kΩ/50 Ω (nom.) selectable
absolute minimum voltage −3 V
► 6 V (with 10 kΩ input impedance)
absolute maximum voltage
► 4 V (with 50 Ω input impedance)
low-to-high input threshold (1.8 ± 0.3) V
high-to-low input threshold (1.15 ± 0.25) V
recorder output; user-definable linear relationship
Out 2 (analog output 2)
to measurement result
electrical characteristics see Out 1
connector BNC (female)
two USB 2.0 high-speed host ports (one on front
USB host ports
panel, one on rear panel)
connector USB type A receptacle
from the R&S®NRP toolkit via LAN or USBTMC
Firmware update using a Windows program; VISA installation is
required
Environmental conditions
Temperature operating temperature range 0 °C to +50 °C (unless otherwise stated)
permissible temperature range –10 °C to +55 °C
storage temperature range –40 °C to +70 °C
+25 °C/+55 °C, 95 % rel. humidity, cyclic,
Damp heat in line with EN 60068-2-30 with restrictions:
noncondensing
Altitude operating or nonoperating max. 4600 m
Mechanical resistance
5 Hz to 55 Hz, 0.15 mm amplitude const.,
Vibration sinusoidal 55 Hz to 150 Hz, acceleration 0.5 g const.,
in line with EN 60068-2-6
10 Hz to 500 Hz, acceleration 1.9 g (RMS),
random
in line with EN 60068-2-64
40 g shock spectrum,
Shock in line with MIL-STD-810E, method 516.4,
procedure I
Power rating
Rated voltage nominal voltage 100 V to 240 V
voltage range 90 V to 264 V
Rated frequency nominal frequency 50 Hz to 60 Hz or 400 Hz
frequency range 47 Hz to 63 Hz or 380 Hz to 420 Hz
Rated current (including options, connected
at 100 V AC max. 1.7 A
sensors, and connected USB devices)
at 240 V AC max. 0.8 A
Product conformity
applied harmonized standards:
► EN 61326-1 (industrial environment)
EU: ► EN 61326-2-1
Electromagnetic compatibility
in line with EMC Directive 2014/30/EU ► EN 55011 (class B)
► EN 61000-3-2
► EN 61000-3-3
EU:
Electrical safety applied harmonized standard: EN 61010-1
in line with Low Voltage Directive 2014/35/EU
USA UL 61010-1
Canada CAN/CSA-C22.2 No. 61010-1
EU: in line with Directive 2011/65/EU on the
RoHS restriction of the use of certain hazardous sub- EN IEC 63000
stances in electrical and electronic equipment
234 mm × 106 mm × 272 mm
Dimensions W × H × D
(9.21 in × 4.17 in × 10.71 in)
Weight without any options installed 2.35 kg (5.18 lb)
Rohde & Schwarz R&S®NRT Power Reflection Meter Family 13
Page14
R&S®NRT-Z5 USB interface adapter
for connecting an R&S®NRT power sensor to a
Application
PC via USB
Sensor input one sensor input
LEMO S series, EBC model, size 2, 6-pole recep-
connector tacle (1: RXD+, 2: RXD−, 3: VSUPPLY, 4: GND,
5: TXD−, 6: TXD+)
Environmental conditions
Temperature operating temperature range 0 °C to +60 °C
storage temperature range –40 °C to +70 °C
max. 90 % rel. humidity, with restrictions:
Damp heat
noncondensing
Altitude operating or nonoperating max. 4600 m
Product conformity
applied harmonized standards:
Electromagnetic compatibility EU: in line with EMC Directive 2014/30/EU ► EN 55022 (class B)
► EN 55024
EU: in line with Directive 2011/65/EU on the
RoHS restriction of the use of certain hazardous sub- EN IEC 63000
stances in electrical and electronic equipment
W × H × D (without protruding sensor 60 mm × 35 mm × 89 mm
Dimensions
connector) (2.36 in × 1.38 in × 3.50 in)
Weight 0.30 kg (0.66 lb)
ORDERING INFORMATION
Designation Type Order No.
Base unit
Power reflection meter R&S®NRT2 1430.0509.02
Options
GPIB/IEEE488 ınterface R&S®NRT2-B8 1430.0105.02
Directional power sensors
120 (300) W, 25 MHz to 1 GHz R&S®NRT-Z14 1444.0006.02
120 (300) W, 0.2 GHz to 4 GHz R&S®NRT-Z44 1444.0012.02
Acessories
Extension cable for R&S®NRT-Zxx power sensors, length: 10 m R&S®NRT-Z2 1081.2505.10
Extension cable for R&S®NRT-Zxx power sensors, length: 30 m R&S®NRT-Z2 1081.2505.30
USB interface adapter R&S®NRT-Z5 1400.6909.02
19" rack adapter (for one R&S®NRT2 power reflection meter and one
R&S®ZZA-KNA22 1177.8184.00
empty casing)
19" rack adapter (for two R&S®NRT2 power reflection meters) R&S®ZZA-KNA24 1177.8149.00
Warranty
Base unit and power sensors 3 years
All other items 1) 1 year
Service options
Extended warranty, one year R&S®WE1
Extended warranty, two years R&S®WE2
Extended warranty with calibration coverage, one year R&S®CW1 Please contact your local
Extended warranty with calibration coverage, two years R&S®CW2 R ohde & Schwarz sales office.
Extended warranty with accredited calibration coverage, one year R&S®AW1
Extended warranty with accredited calibration coverage, two years R&S®AW2
1) For options installed, the remaining base unit warranty applies if longer than 1 year. Exception: all batteries have a 1 year warranty.
14
Page15
1) Depends on measurement function and direction.
2) Ratio of measured forward and reverse power in dB with perfectly matched load.
3) Specifications apply to measurement of forward power.
4) Values in [ ]: 2 ▷ 1 forward direction (if different from 1 ▷ 2 forward direction).
5) Power measurement below the specified limits is possible at the expense of increased influence of zero offset.
6) Measurement of average power up to the CW limits is possible at the expense of increased measurement errors.
7) Increased uncertainty with a coverage factor of k = 2. For normal distribution, this coverage factor has a coverage probability of 95 %.
8) With matched load (SWR max. 1.2) under consideration of the carrier frequency which must be input for an accuracy of 1 %; measurement results referenced to the load
end of the sensor, averaging filter set to automatic mode (high resolution). The influence of the carrier harmonics can be ignored provided they are below −30 dBc up to
5 GHz. With an SWR of more than 1.2 on the load end, the influence of directivity on the measured forward power is to be considered. The associated increased uncer-
tainty with a coverage factor of k = 2 is equal to 6 % of rdg (0.25 dB) × the load reflection coefficient. Example: a mismatched load with 3.0 SWR yields a 0.5 reflection
coefficient, producing an additional uncertainty of 3 % of rdg (0.13 dB). The overall measurement uncertainty will be increased to 4.4 % of rdg (0.19 dB).
9) With matched load (SWR max. 1.2) under consideration of the carrier frequency which must be input for an accuracy of 1 %; measurement results referenced to the load
end of the sensor, averaging filter set to automatic mode (high resolution). The influence of harmonics of the carrier can be neglected provided they are below −30 dBc
up to 4 GHz, −35 dBc from 4 GHz to 10 GHz and −60 dBc above 10 GHz. With an SWR of more than 1.2 on the load end, the influence of directivity on measured for-
ward power is to be considered. The associated increased uncertainty with a coverage factor of k = 2 equals 6 % of rdg (0.25 dB) × load reflection coefficient for carrier
frequencies up to 3 GHz and 10 % of rdg (0.4 dB) × load reflection coefficient from 3 GHz to 4 GHz. Example: a mismatched load with 3.0 SWR yields a 0.5 reflection
coefficient leading to an additional uncertainty of 3 % of rdg (0.13 dB) in the frequency range up to 3 GHz. Overall measurement uncertainty will be increased to 4.4 % of
rdg (0.19 dB).
10) After zero adjustment.
11) In the temperature range from +18 °C to +28 °C; relative to a CW signal. The error depends on the modulation parameters for each case, e.g. the modulation frequency
with AM and the individual sensor characteristics. The specified tolerances refer to 1 ▷ 2 forward direction and a power of 120 W (R&S®NRT-Z44). With burst signals,
the specified errors refer to an average burst power of 120 W (R&S®NRT-Z14/-Z44). Since errors due to modulation are proportional to power, they become smaller the
lower the power: a WCDMA signal with an average power of 30 W, for example, will only cause a very small error of about ±0.5 % of the R&S®NRT-Z44 sensor with
modulation correction switched on.
12) With modulation correction switched on.
13) With modulation correction switched on (same as WCDMA); chip rate set to 3.6864 Mchip/s.
14) Signal similar to test model 1 with 64 channels for downlink with 3.84 Mchip/s in line with 3GPP standard 3G TS 25.141 V3.1.0 (2000-03); modulation correction
switched on, chip rate set according to test signal.
15) Statistically distributed with a mean value of 0 %/K, the stated temperature coefficients correspond to approximately two standard deviations. Temperature coefficients
must be considered for calculation of measurement uncertainty below +18 °C and above +28 °C. Example: at +5 °C and 1 GHz, a temperature drift of
(18 − 5) × 0.25 % = 3.25 % of rdg (0.14 dB) for average power measurement can be expected relative to +18 °C. Combined with the measurement uncertainty of 3.2 %
from +18 °C to +28 °C, the overall uncertainty will be 4.6 % of rdg (0.19 dB).
16) Typical values; measured with R&S®NRT-Z5, average time of 100 measurements. Measurement results settled with power-dependent (automatic) averaging. Each mea-
surement time is defined as the time from the input of the trigger command up to the termination of the return string (baud rate 38.4 kbit/s). All measurement results
consist of two measured values: one for the forward power measurement function and one for the selected reflection parameter (SWR, return loss, reflection coefficient
or reflected power).
17) After zero adjustment, unmodulated burst signal with rectangular envelope. The burst power must be at least 4 W for the R&S®NRT-Z14 and the R&S®NRT-Z44. For the
R&S®NRT-Z44, the burst width must be > 2 ms {4 kHz}, > 40 µs {200 kHz} and > 5 µs {”FULL”}. For the R&S®NRT-Z14, the burst width must be > 2 ms {4 kHz}, > 40 µs
{200 kHz} and > 10 µs {”FULL”}. Since the measurement uncertainty is inversely proportional to the burst width and the power, it may be smaller or higher for other
waveforms.
18) In the temperature range from +18 °C to +28 °C; video bandwidth “FULL“, PEP defined as power with a CCDF value < 10–6.
19) Setting must be initiated with a “rev:pow“ command in addition to the setting command for the forward measurement function via the remote interface of the sensor.
Since the sensor measures average reverse power with this setting (a parameter normally not of interest in combination with any function other than average power
measurement), the setting is denoted as “PEP measurement only“ or “CCDF measurement only“.
20) After zero adjustment, unmodulated burst signal with rectangular envelope, threshold value set to half the burst power. The burst power must be at least 4 W for the
R&S®NRT-Z44. For the R&S®NRT-Z44, the repetition rate must be < 50/s {4 kHz}, < 2500/s {200 kHz}, and < 20000/s {”FULL”}. For the R&S®NRT-Z14, the repetition rate
must be < 50/s {4 kHz}, < 2500/s {200 kHz} and < 10000/s {”FULL”}. Since the measurement uncertainty is proportional to the repetition rate and inversely proportional
to the power, it may be smaller or higher for other waveforms. For spread spectrum signals such as cdmaOne, CDMA2000®(3x), WCDMA, DAB and DVB-T, the mea-
surement uncertainty is optimally described by an uncertainty for the threshold setting. This uncertainty is taken into account in addition to the specified value. With
modulation correction switched on, this additional uncertainty is approx. 5 % of the power value in W for the aforementioned standards.
21) Using double-shielded twisted pair cable with a characteristic impedance of 100 Ω and a cross section of ≥ 0.22 mm2 (24 AWG) for the data lines is recommended to
achieve the advertised performance and electromagnetic immunity. Minimizing voltage drop can require a larger cross section of e.g. 0.5 mm2 (20 AWG) for the power
supply lines.
CDMA2000® is a registered trademark of the Telecommunications Industry Association (TIA-USA).
Rohde & Schwarz R&S®NRT Power Reflection Meter Family 15
Page16
Rohde & Schwarz
Service that adds value The Rohde & Schwarz technology group is among the trail-
► Worldwide blazers when it comes to paving the way for a safer and
► Local and personalized connected world with its leading solutions in test & measure-
► Customized and flexible ment, technology systems and n etworks & cybersecurity.
► Uncompromising quality
► Long-term dependability Founded more than 85 years ago, the group is a reliable
partner for industry and government customers around
the globe. The independent company is headquartered in
Munich, Germany and has an extensive sales and service
network with locations in more than 70 countries.
www.rohde-schwarz.com
Sustainable product design
► Environmental compatibility and eco-footprint
► Energy efficiency and low emissions
► Longevity and optimized total cost of ownership
Certified Quality Management Certified Environmental Management
ISO 9001 ISO 14001
Rohde & Schwarz training
www.training.rohde-schwarz.com
Rohde & Schwarz customer support
www.rohde-schwarz.com/support
R&S® is a registered trademark of Rohde & Schwarz GmbH & Co. KG
Trade names are trademarks of the owners
PD 5215.0986.12 | Version 05.00 | March 2022 (sk)
R&S®NRT Power Reflection Meter Family
Data without tolerance limits is not binding | Subject to change
© 2017 - 2022 Rohde & Schwarz GmbH & Co. KG | 81671 Munich, Germany
5215.0986.12 05.00 PDP/PDW 1 en 5215098612