Page1
LDD Weld Measurement System �IPG Japan Fiber Days
LDD 溶接部測定システム
LDD Weld Measurement System
IPG Japan Fiber Days
Chubu Applications Center, June 2026
David Ebel, P.Eng. プロフェッショナル・エンジニア(技術士)
IPG Photonics Canada, LDD
Page2
Presentation Itinerary
発表プログラム
Presentation Itinerary
LDD 700 Technology Overview LDD700 技術概要
Process Monitoring, ROI Case Studies 溶接モニタリング、投資効果
Global Footprint, Utilization 世界展開、市場採用実績
Relevant Application Examples 適用アプリケーション例
New Development 新開発技術
Page3
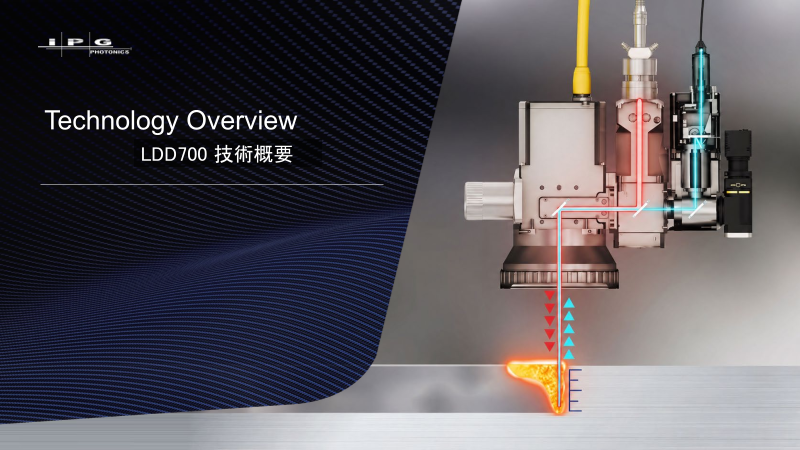
Technology Overview
Technology Overview
LDD700 技術概要
Page4
LDD: In-Process Weld Measurements
LDD: In-Process Weld Measurements プロセス中の溶接部測定
加工ヘッドを通じて溶接中にリアルタイム測定可能
Real-time weld measurements through beam delivery optics.
製造部品の全数検査が可能
LDD inspects 100% of parts produced.
溶接部の直接測定が可能、非接触のモニタリングよりも品質確認に優位
LDD provides direct objective measurements, superior to
indirect ‘monitoring’ technology.
10年以上にわたる現場での使用実績、世界初の溶接部測定用OCTシステム
World-first laser weld measurement OCT system. Battle-
Proven technology with over a decade of customer use.
幅広い市場で採用され、高い信頼を獲得
Mass market adoption and trust.
世界規模のサポート体制と、強力な特許ポートフォリオ
Backed by a global support network and robust patents.
サンプリングレート Max. acquisition rate 250 kHz
進行方向解像度 Axial resolution <20 ????
幅方向解像度 Transverse resolution 25 ???? (typical)
LDD measures every part before it leaves the factory.
LDDを用いてすべての製品の出荷前検査を実施可能です
© 2026 IPG Photonics 4
Page5
LDD Measurement Modes: Overview
LDD Measurement Modes: Overview LDDの測定項目
Five Main Measurement Modes 測定項目主要5点
溶接前シーム形状 - 加工前方を走査し、継手位置や位置ずれを検出
ワーク高さ - 材料表面と溶接光学系との距離を測定し、他の計測の基準点として使用
キーホール深さ - 溶接中にキーホール内部を計測し、実際の溶け込み深さをリアルタイムで算出
溶接後ビード高さ - 溶融池の直後で計測を行い、形成された溶接ビードの高さ方向の情報を取得
溶接後ビード幅 - 形成された溶接ビードの幅方向の情報を取得
© 2026 IPG Photonics 5
Page6
Measurements: QA Thresholds
Measurements: QA Thresholds 品質管理パラメータ
20+ QA Metrics 20以上の品質管理項目
シームギャップ エッジ位置 溝深さ 接触位置 ギャップ中央
ワーク高さ
段差高さ エッジ高さ 溝位置
ビード左端 最高部 ビード中央
ビード高さ
ビード右端 最深部 ビード幅
キーホール深さ 信号密度 ビード断面形状
© 2026 IPG Photonics 6
Page7
LDD Measurement Cycle
LDD Measurement Cycle 測定サイクル
In-Line Coaxial Measurement Beam 同軸ビームによるインライン測定
LDD Beam LDDからの測定用レーザ
LDD Welding
Beam Beam
発振器からの加工用レーザ
Processing Laser 溶接後ビード
LDD Finished
Weld Surface
LDD 3D Module シーム形状
(3DM) LDD Seam
Geometry
Weld Head
溶接ヘッド
LDD
= Imaging beam Keyhole
= Processing beam キーホール
© 2026 IPG Photonics 7
Page8
LDD Data, Simultaneous Measurements
LDD Data, Simultaneous Measurements 複数パラメータ同時測定
Five Main Measurement Modes 主要測定項目5点
溶接表面
Finished Weld Surface
Keyhole Depth
キーホール深さ
ワーク高さ
Workpiece Height
シーム位置
Seam Location
ビード幅方向プロファイル
Transverse Profile
© 2026 IPG Photonics 8
Page9
LDD-700 and MM Processes
LDD-700 and MM Processes マルチモードビームとLDD
Synchrotron X-ray Validation 放射光X線を用いた、LDD測定妥当性の検証
LDDのキーホール深さ計測を、放射光X線でフレームごとに検証 Aluminium, 1 kW core/1 kW ring, 200 mm/s, 300 Hz/0.5 mm Circular Wobble
YLS-4000-4000-AMB-CT, 50/600 fiber, D33 Scanner, 413/140, 148 µm nom. core spot size
• Frame-by-frame Synchrotron
X-ray validation of LDD
keyhole depth measurements
• 1000s of datapoints per weld,
compared with typical 1-10
metallographic cross- 0
sections per weld 250
1溶接あたり数千点のデータ取得が可能
(従来の断面観察は通常1~10断面) 500
750
銅バスバーと端子の溶接
Cu Busbar to terminal welding 1000
Copper, 2 kW core/0 kW ring, 400 mm/s
YLS-3000-5000-SM-AMB, SM/250 fiber, D20 Scanner, 260/85, 42 µm nom. core spot size
© 2026 IPG Photonics 9
Depth (µm)
Page10
LDD-700 and SM Processes
LDD-700 and SM Processes シングルモードビームとLDD
Synchrotron X-ray Validation, <1 ms Process Defects 1ms以下の瞬間的加工欠陥検出(放射光X線でも検証)
鉄材
Steel
Single-mode
0.5 kW, 400 mm/s
アルミ材
Aluminum
Single-mode
1 kW, 1000 mm/s
© 2026 IPG Photonics 10
Page11
LDD-700 and SM Processes
LDD-700 and SM Processes シングルモードビームとLDD
Synchrotron X-ray Validation, <1 ms Process Defects 1ms以下の瞬間的加工欠陥検出(放射光X線でも検証)
銅材
Copper
Single-mode
2 kW, 400 mm/s
© 2026 IPG Photonics 11
Page12
LDD Repeatable Weld Validation
LDD Repeatable Weld Validation 繰返し 溶接深さ測定の検証
Single Mode Process シングルモードビーム
LDD vs 顕微鏡 測定結果 (負極の溶接) LDD vs 顕微鏡 測定結果 (正極の溶接)
LDD vs Microscopy Results (Negative Terminal) LDD vs Microscopy Results (Positive Terminal)
-480 -460 -440 -420 -400 -380 -360 -340 -660 -640 -620 -600 -580 -560 -540
-320 -520
LDD Keyhole Depth (μm) LDD Keyhole Depth (μm)
LDDキーホール深さ -340 LDDキーホール深さ
-540
y = 0.975x + 10.5 -360
R² = 0.976 y = 0.952x - 4.56 -560
-380 R² = 0.963
-580
-400
-600
-420
-440 -620
-460 -640
Across 250 welds & 1,000 section locations, LDD depth measurement
matches destructive cross-section measurements.
250本の溶接・1000箇所の断面評価において、LDD測定値は破壊断面観察結果と良好に一致
© 2026 IPG Photonics 12
切断して顕微鏡で
計測した溶け込み深さ
Section Depth (μm)
切断して顕微鏡で
計測した溶け込み深さ
Section Depth (μm)
Page13
LDD Repeatable Weld Validation
LDD Repeatable Weld Validation 繰返し 溶接深さ測定の検証
Single Mode Process シングルモードビーム
LDD測定残差
LDD Fit Residuals
LDD Fit Residuals
-700 -680 -660 -640 -620 -600 -580 -560 -540 -520 -500 -480 -460 -440 -420 -400 -380 -360 -340 -320 -300
50.0
LDD Keyhole Depth [um]
キーホール深さ 40.0
30.0
20.0
10.0
0.0
-10.0
-20.0
残差 (正極) 残差 (負極) -30.0
Residual (positive terminal) Residual (negative terminal) -40.0
-50.0
LDD results showed random residual errors centered around zero.
Magnitude of errors were observed to be within the range of +/- 10 µm for the overall fit.
LDD測定値に有意なバイアスは認められず、全体の誤差は±10 µm以内であった
© 2026 IPG Photonics 13
残差 LDDと顕微鏡の測定値差
Residual Error [um]
Page14
Process Monitoring and ROI
Process Monitoring and ROI
溶接モニタリングと投資効果
Page15
What is the Cost of a Defect?
What is the Cost of a Defect? 溶接欠陥がもたらすコスト
不良セルの損失:1倍 不良モジュールの損失:10倍 不良パックの損失:100倍
Cost of a Defective Cost of a Defective Cost of a Defective
Cell: 1x$ Module: 10x$ Pack: 100x$
工程の早い段階で検出されない場合、欠陥コストは累積する
The cost of a defect will accrue if not detected early in the process.
Some Defects Cannot be
Laser Welding Process Failures Detected With Conventional Higher Defect Rates = High LDD Can Enable Calculated
Are Difficult to Predict Testing Until the Final Product Is Scrap Costs and More Waste Rework, Further Reducing
Completed Scrap
LDDは、測定結果に基づく適
レーザー溶接不良は予測が難しい 一部の欠陥は、従来の検査では 不良率の増加は、廃棄コストと 切な再加工を可能にし、廃棄
最終製品完成まで検出できない 材料ロスの増加につながる をさらに低減する
Robust QA is critical to ensure defects do not reach end users.
不良品の市場流出を防ぐためには、堅牢な品質保証が不可欠である
Using LDD to measure 100% of all parts welded, defects are caught before compounding.
LDDによる全数検査で、欠陥を早期に発見し、損失の拡大を防止できる
© 2026 IPG Photonics 15
Page16
In-Process Weld Measurements
In-Process Weld Measurements 溶接状態のインプロセス測定
Non-Destructive, 100% Instant Inspection 非破壊・全数リアルタイム検査
従来の抜き取り・破壊検査は効率が低く、不良流出による設備停止、製品保留、追加検査のリスクを伴う
Traditional quality checks are often periodic and destructive. This is inefficient and can risk bad
parts escaping resulting in lengthy downtime, quarantines, and additional inspection.
工程は経時変化や突発変動により品質が低下する可能性があり、
Upper Tolerance Limit 即時検知は容易ではない。
• Over time, a process can vary or drift from acceptable
Quality tolerance limits, leading to degradation of quality.
Metric • Sudden process changes are nearly impossible to predict
品質指標 and challenging to identify when they occurred.
Lower Tolerance Limit Corrective
Time PrAocteiosns Drift • Manufacturers often lack the tools to detect these
changes immediately.
品質が保たれているか不明 工程の見直し
QA UNKNOWN
LDDは全ての部品を直接測定し、工程変化を即座に検知する
LDD provides direct measurements of every part, immediately detecting changes in the process.
Upper Tolerance Limit
• Process changes can be immediately caught and
Quality corrected using LDD.
Metric • Direct LDD measurements of part quality can enable
品質指標 In-Line Rework rework of failed parts, eliminating scrap.
Lower Tolerance Limit Corrective Action LDDにより工程変化を即座に検知し、補正可能。LDDによる直接計
Time 工程内で再加工 測により、不良品の再加工を可能とし、廃棄を削減する。
© 2026 IPG Photonics 16
Page17
Case Study: Photodiode vs LDD
Case Study: Photodiode vs LDD 事例紹介:フォトダイオードによる監視とLDDの比較
Tier1自動車部品サプライヤー フォトダイオード方式
生産数:6,000個/日
部品単価:160ドル/個 Photodiode
不良品検出数
Rejected Parts フォトダイオード方式では約2%の誤判定が発生し、1日あたり約
120個が廃棄対象となり、19,200ドル/日の損失が生じていた。
Company: Tier 1 Photodiode returned a 2% failure rate
Automotive Industry
Supplier X 120 resulting in ~120 scrapped parts per
day, costing the company $19,200.
X 6,000 LDD方式
LDD
不良品検出数
The OEM produced Rejected Part LDDは誤判定を解消し、廃棄数を99%削減。1日あたり
19,000ドル以上のコスト削減を実現。
6,000 parts each day. LDD eliminated false failures, reducing
Each part cost $160. X 1 the number of scrapped parts by 99%,
saving the company > $19,000 per day.
© 2026 IPG Photonics 17
LDD ROI Case Study: Scrap Reduction LDD導入効果事例:スクラップ削減
バッテリーモジュール製造のため、薄肉銅部材を溶接 部品品質のばらつきにより、30%の
セルモジュールで再加工が発生
Customer was Welding 30% of Cell Modules Required
Thin Cu Lattice to Make at least 1 Rework Due to
Battery Modules 0.4 Inconsistent Part Quality
mm
Tab-to-Cell (SM + Scanner)
インライン溶接計測を活用し、再加工を行うことでスクラップ低減を実現
Using Inline Weld Imaging to enable cost-saving rework protocols to
eliminate scrap
部品ばらつきに Inconsistent part
起因する溶接欠陥 caused weld defect
溶接欠陥検出 → 再加工実施
Defective Weld—Perform Rework
Copper Busbar to
Terminal Weld
銅バスバーと端子の溶接
Reworked—High-Quality Weld
再加工後 → 良好な溶接品質
© 2026 IPG Photonics 18
Page19
LDD ROI Case Study: E-Mobility Customer
LDD ROI Case Study: E-Mobility Customer
LDD導入効果事例(Eモビリティ分野)
年間100万モジュール 400セル / モジュール 溶接不良発生率 6σ 年間2,700モジュール LDDによる100%検出
年間2,700件 の不良発生
1M 400 6σ yield:
Up to 2,700 failed 100% Detection
modules/year cells/module 2,700 failed modules/year
welds/year with LDD
全数検査により、不良品の市場流出リスクを低減
品質
Quality & • 100% Parts Inspected reduces chance of bad parts reaching
Customer customers
不良溶接の再加工により、年間270万ドルのコスト削減
コスト
Cost • $2.7 million per year in savings through reworking failed welds.
年間100万個以上のリチウムイオンセルの廃棄を削減
環境
Environment • Eliminating scrap of over 1 million lithium-ion cells per year
LDD creates ROI by reducing scrap and downstream processing costs
LDDは、廃棄削減と後工程コスト低減により高い投資効果を実現する
© 2026 IPG Photonics 19
Page20
Global Footprint &�Market Adoption
Global Footprint &
Market Adoption
世界展開と市場採用実績